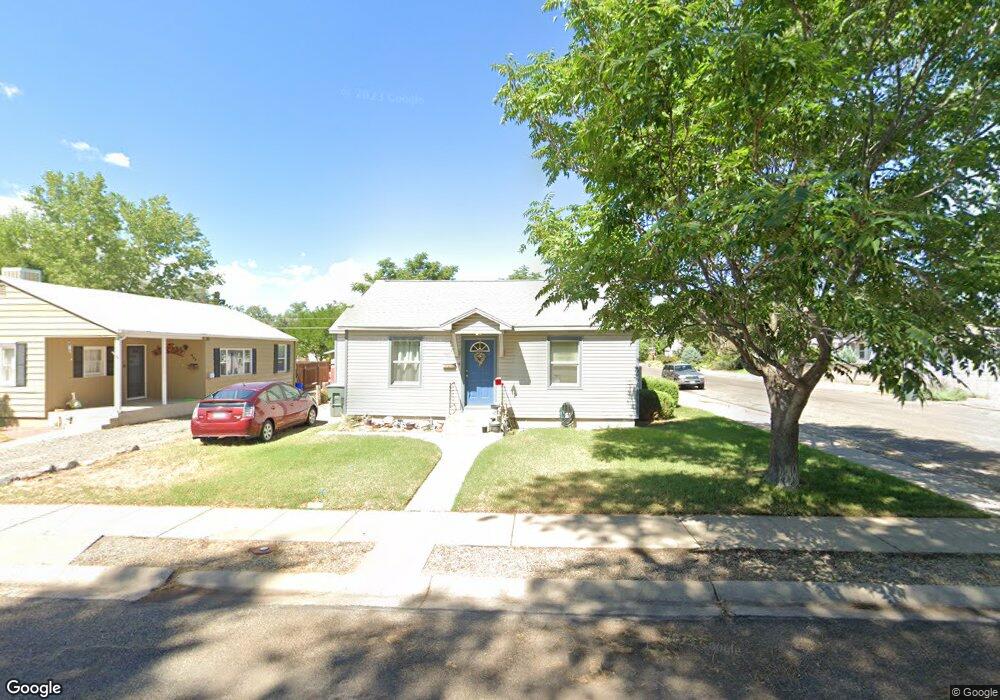
449 N 16th St Grand Junction, CO 81501
Downtown Grand Junction NeighborhoodEstimated Value: $261,019 - $369,000
4
Beds
3
Baths
1,296
Sq Ft
$255/Sq Ft
Est. Value
About This Home
This home is located at 449 N 16th St, Grand Junction, CO 81501 and is currently estimated at $330,505, approximately $255 per square foot. 449 N 16th St is a home located in Mesa County with nearby schools including Chipeta Elementary School, East Middle School, and West Middle School.
Ownership History
Date
Name
Owned For
Owner Type
Purchase Details
Closed on
Jan 16, 2023
Sold by
Erickson William J
Bought by
Erickson Colorado Investments Llc
Current Estimated Value
Purchase Details
Closed on
Jan 18, 2019
Sold by
Cjk Investments Group Llc
Bought by
Erickson William J
Purchase Details
Closed on
Nov 14, 2017
Sold by
Gardner Sandra
Bought by
Cjk Investment Group Llc
Purchase Details
Closed on
Nov 19, 2015
Sold by
Erickson William James
Bought by
Erickson William J and Gardner Sandra
Purchase Details
Closed on
Aug 16, 1996
Sold by
Trustee William J Erickson Harry R Erickson
Bought by
Erickson William J and Erickson Harry R
Purchase Details
Closed on
May 19, 1995
Sold by
Mueller Frank D
Bought by
Erickson William J
Purchase Details
Closed on
May 16, 1995
Sold by
Erickson William J
Bought by
Erickson William J
Create a Home Valuation Report for This Property
The Home Valuation Report is an in-depth analysis detailing your home's value as well as a comparison with similar homes in the area
Home Values in the Area
Average Home Value in this Area
Purchase History
| Date | Buyer | Sale Price | Title Company |
|---|---|---|---|
| Erickson Colorado Investments Llc | -- | -- | |
| Erickson William J | $7,500 | None Available | |
| Cjk Investment Group Llc | -- | None Available | |
| Erickson William J | -- | None Available | |
| Erickson William J | -- | -- | |
| Erickson William J | $76,000 | -- | |
| Erickson William J | -- | -- |
Source: Public Records
Tax History Compared to Growth
Tax History
| Year | Tax Paid | Tax Assessment Tax Assessment Total Assessment is a certain percentage of the fair market value that is determined by local assessors to be the total taxable value of land and additions on the property. | Land | Improvement |
|---|---|---|---|---|
| 2024 | $1,363 | $19,280 | $4,780 | $14,500 |
| 2023 | $1,363 | $19,280 | $4,780 | $14,500 |
| 2022 | $1,289 | $17,880 | $3,820 | $14,060 |
| 2021 | $1,294 | $18,400 | $3,930 | $14,470 |
| 2020 | $976 | $14,210 | $3,580 | $10,630 |
| 2019 | $923 | $14,210 | $3,580 | $10,630 |
| 2018 | $746 | $10,550 | $3,240 | $7,310 |
| 2017 | $744 | $10,550 | $3,240 | $7,310 |
| 2016 | $703 | $11,210 | $3,380 | $7,830 |
| 2015 | $712 | $11,210 | $3,380 | $7,830 |
| 2014 | $656 | $10,410 | $2,790 | $7,620 |
Source: Public Records
Map
Nearby Homes