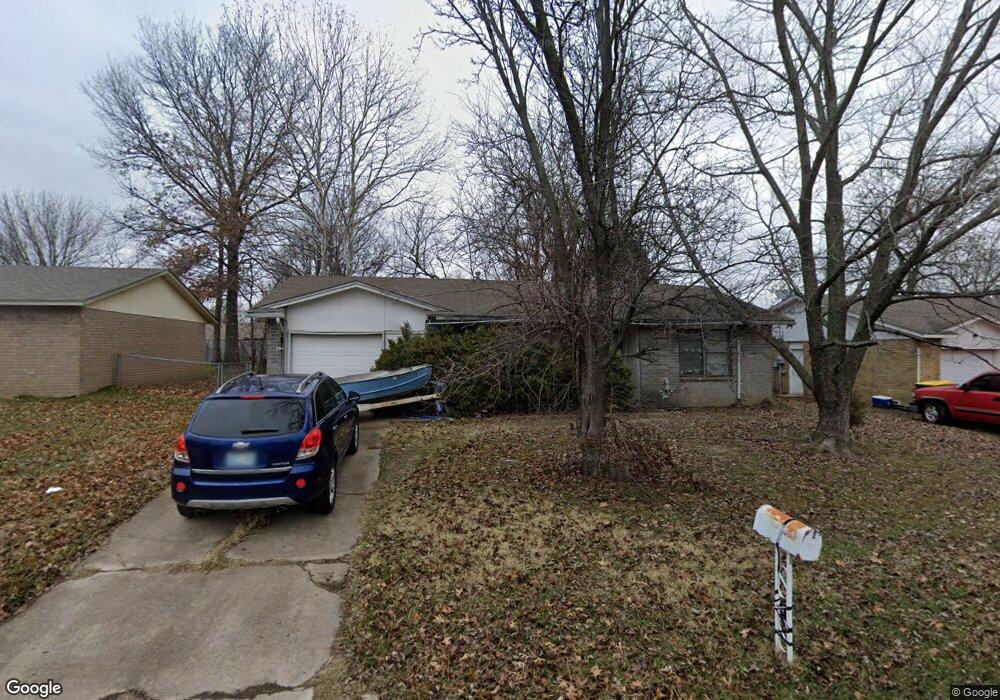
449 W 149th Place Glenpool, OK 74033
Estimated Value: $169,866 - $180,000
3
Beds
1
Bath
1,040
Sq Ft
$168/Sq Ft
Est. Value
About This Home
This home is located at 449 W 149th Place, Glenpool, OK 74033 and is currently estimated at $175,217, approximately $168 per square foot. 449 W 149th Place is a home located in Tulsa County with nearby schools including Glenpool Elementary School, Glenpool Middle School, and Glenpool High School.
Ownership History
Date
Name
Owned For
Owner Type
Purchase Details
Closed on
May 27, 2005
Sold by
Miller Traci M and Miller Timothy R
Bought by
Myers Rex E
Current Estimated Value
Home Financials for this Owner
Home Financials are based on the most recent Mortgage that was taken out on this home.
Original Mortgage
$78,300
Outstanding Balance
$41,061
Interest Rate
5.83%
Mortgage Type
Fannie Mae Freddie Mac
Estimated Equity
$134,156
Purchase Details
Closed on
Feb 11, 2003
Sold by
Miller Traci M and Miller Timothy R
Bought by
Miller Timothy R and Miller Traci M
Purchase Details
Closed on
Jun 6, 2001
Sold by
Anderson Mark V
Bought by
Anderson Stephens Traci M
Purchase Details
Closed on
Oct 23, 1998
Sold by
Brand Kenny E and Brand Sherri L
Bought by
Anderson Mark V and Anderson Traci M
Home Financials for this Owner
Home Financials are based on the most recent Mortgage that was taken out on this home.
Original Mortgage
$54,385
Interest Rate
6.61%
Mortgage Type
Purchase Money Mortgage
Purchase Details
Closed on
Feb 1, 1995
Create a Home Valuation Report for This Property
The Home Valuation Report is an in-depth analysis detailing your home's value as well as a comparison with similar homes in the area
Home Values in the Area
Average Home Value in this Area
Purchase History
| Date | Buyer | Sale Price | Title Company |
|---|---|---|---|
| Myers Rex E | $77,000 | The Executives Title & Escro | |
| Miller Timothy R | -- | First Amer Title & Abstract | |
| Anderson Stephens Traci M | -- | -- | |
| Anderson Mark V | $54,000 | -- | |
| -- | $39,000 | -- |
Source: Public Records
Mortgage History
| Date | Status | Borrower | Loan Amount |
|---|---|---|---|
| Open | Myers Rex E | $78,300 | |
| Previous Owner | Anderson Mark V | $54,385 |
Source: Public Records
Tax History Compared to Growth
Tax History
| Year | Tax Paid | Tax Assessment Tax Assessment Total Assessment is a certain percentage of the fair market value that is determined by local assessors to be the total taxable value of land and additions on the property. | Land | Improvement |
|---|---|---|---|---|
| 2024 | $1,256 | $11,268 | $1,614 | $9,654 |
| 2023 | $1,256 | $10,731 | $1,687 | $9,044 |
| 2022 | $1,178 | $10,221 | $2,124 | $8,097 |
| 2021 | $1,139 | $9,734 | $2,023 | $7,711 |
| 2020 | $1,148 | $9,734 | $2,023 | $7,711 |
| 2019 | $1,127 | $9,490 | $1,972 | $7,518 |
| 2018 | $1,068 | $9,038 | $1,878 | $7,160 |
| 2017 | $1,045 | $9,038 | $1,878 | $7,160 |
| 2016 | $1,039 | $8,894 | $1,848 | $7,046 |
| 2015 | $984 | $8,470 | $1,760 | $6,710 |
| 2014 | $989 | $8,470 | $1,760 | $6,710 |
Source: Public Records
Map
Nearby Homes
- 571 W 149th Place
- 467 W 147th Place S
- 598 W 147th Place S
- 14666 S Yukon Ave
- 803 W 150th St
- 15002 S Justin Ave
- 41 E 148th St
- 15375 S 26th West Ave
- 13708 S Elwood Ave
- 14812 S Fern Place
- 14760 S Fern Place
- 14785 S Fern Place
- 14336 S Barber St
- 394 E 147th St S
- 110 E 156th Place S
- 393 E 147th St S
- 14324 S Dogwood St
- 14920 S Sequoia St
- 14910 S Sequoia St
- 5 E 157th Place S
- 461 W 149th Place
- 427 W 149th Place
- 450 W 149th St S
- 450 W 149th St
- 462 W 149th St S
- 462 W 149th St
- 483 W 149th Place
- 428 W 149th St
- 405 W 149th Place
- 442 W 149th Place
- 442 W 149th Place S
- 494 W 149th St
- 464 W 149th Place
- 406 W 149th St
- 430 W 149th Place
- 515 W 149th Place S
- 515 W 149th Place
- 496 W 149th Place
- 408 W 149th Place
- 508 W 149th Place