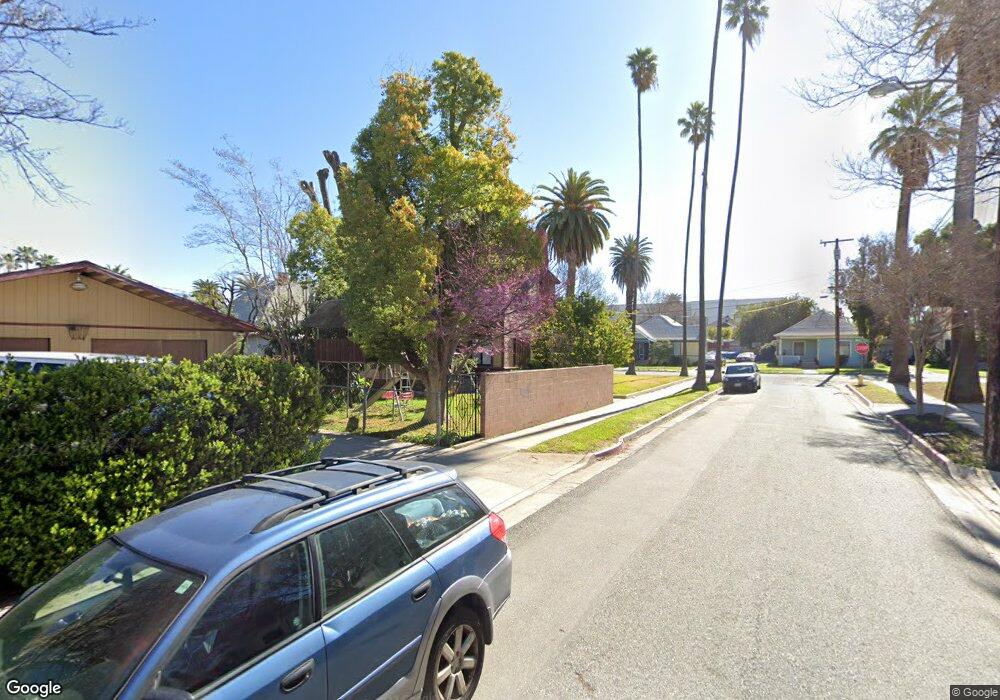
4493 Orange St Riverside, CA 92501
Downtown Riverside NeighborhoodEstimated Value: $599,596 - $783,000
5
Beds
2
Baths
1,872
Sq Ft
$366/Sq Ft
Est. Value
About This Home
This home is located at 4493 Orange St, Riverside, CA 92501 and is currently estimated at $684,899, approximately $365 per square foot. 4493 Orange St is a home located in Riverside County with nearby schools including Pachappa Elementary School, Central Middle School, and Polytechnic High School.
Ownership History
Date
Name
Owned For
Owner Type
Purchase Details
Closed on
Oct 9, 2008
Sold by
Gross Russell F and Gross Clara A
Bought by
Gross Russell F and Gross Clara A
Current Estimated Value
Purchase Details
Closed on
Oct 5, 2004
Sold by
Wong Joseph
Bought by
Mills Nancy
Home Financials for this Owner
Home Financials are based on the most recent Mortgage that was taken out on this home.
Original Mortgage
$304,000
Outstanding Balance
$150,253
Interest Rate
5.74%
Mortgage Type
Seller Take Back
Estimated Equity
$534,646
Purchase Details
Closed on
Oct 4, 2004
Sold by
Gross Russell F and Gross Clara A
Bought by
Mills Nancy and Parker Tiffant M
Home Financials for this Owner
Home Financials are based on the most recent Mortgage that was taken out on this home.
Original Mortgage
$304,000
Outstanding Balance
$150,253
Interest Rate
5.74%
Mortgage Type
Seller Take Back
Estimated Equity
$534,646
Purchase Details
Closed on
Nov 10, 1994
Sold by
Federal Home Loan Mortgage Corporation
Bought by
Shelton Beverly M
Create a Home Valuation Report for This Property
The Home Valuation Report is an in-depth analysis detailing your home's value as well as a comparison with similar homes in the area
Home Values in the Area
Average Home Value in this Area
Purchase History
| Date | Buyer | Sale Price | Title Company |
|---|---|---|---|
| Gross Russell F | -- | None Available | |
| Mills Nancy | -- | First American Title Co | |
| Mills Nancy | $331,000 | First American Title Co | |
| Shelton Beverly M | $42,000 | Orange Coast Title |
Source: Public Records
Mortgage History
| Date | Status | Borrower | Loan Amount |
|---|---|---|---|
| Open | Mills Nancy | $304,000 |
Source: Public Records
Tax History Compared to Growth
Tax History
| Year | Tax Paid | Tax Assessment Tax Assessment Total Assessment is a certain percentage of the fair market value that is determined by local assessors to be the total taxable value of land and additions on the property. | Land | Improvement |
|---|---|---|---|---|
| 2025 | $824 | $70,625 | $18,256 | $52,369 |
| 2023 | $824 | $67,886 | $17,549 | $50,337 |
| 2022 | $806 | $66,555 | $17,205 | $49,350 |
| 2021 | $813 | $65,251 | $16,868 | $48,383 |
| 2020 | $807 | $64,583 | $16,696 | $47,887 |
| 2019 | $793 | $63,318 | $16,369 | $46,949 |
| 2018 | $778 | $62,078 | $16,051 | $46,027 |
| 2017 | $766 | $60,862 | $15,737 | $45,125 |
| 2016 | $721 | $59,670 | $15,429 | $44,241 |
| 2015 | $710 | $58,776 | $15,199 | $43,577 |
| 2014 | $703 | $57,626 | $14,902 | $42,724 |
Source: Public Records
Map
Nearby Homes
- 4562 Orange St
- 4581 Main St
- 4308 Lime St
- 4224 Brockton Ave
- 0 371 0 Hwy
- 5062 Magnolia Ave
- 3594 Castle Reagh Place
- 4056 Ramona Dr
- 2992 Date St
- 4073 Cedar St
- 4302 Park Ave
- 4415 12th St
- 4096 Pine St
- 2786 Pleasant St
- 3569 Bandini Ave
- 2810 11th St
- 2790 11th St
- 3096 Panorama Rd Unit D
- 3515 Linwood Place
- 4264 Victoria Ave