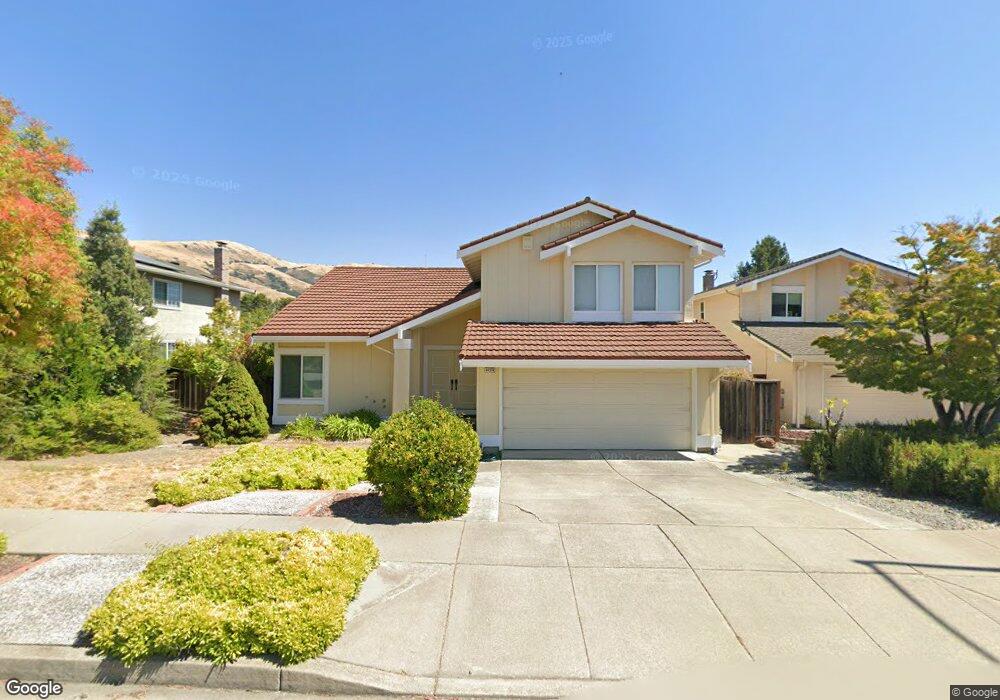
44974 Naragansett Ct Fremont, CA 94539
Weibel NeighborhoodEstimated Value: $2,654,245 - $3,176,000
--
Bed
--
Bath
2,443
Sq Ft
$1,155/Sq Ft
Est. Value
About This Home
This home is located at 44974 Naragansett Ct, Fremont, CA 94539 and is currently estimated at $2,822,561, approximately $1,155 per square foot. 44974 Naragansett Ct is a home located in Alameda County with nearby schools including Fred E. Weibel Elementary School, John M. Horner Junior High School, and Irvington High School.
Ownership History
Date
Name
Owned For
Owner Type
Purchase Details
Closed on
Aug 24, 2016
Sold by
Ju Zhengwen and Wang Yulan
Bought by
Ju Zhengwen and Wang Yulan
Current Estimated Value
Purchase Details
Closed on
Feb 22, 2008
Sold by
Ju Zhengwen and Wang Yulan
Bought by
Ju Zhengwen and Wang Yulan
Home Financials for this Owner
Home Financials are based on the most recent Mortgage that was taken out on this home.
Original Mortgage
$184,000
Interest Rate
5.64%
Mortgage Type
New Conventional
Purchase Details
Closed on
Aug 15, 2002
Sold by
Ju Zhengwen and Wang Yulan
Bought by
Ju Zhengwen and Wang Yulan
Home Financials for this Owner
Home Financials are based on the most recent Mortgage that was taken out on this home.
Original Mortgage
$300,700
Interest Rate
6.52%
Mortgage Type
Balloon
Purchase Details
Closed on
Feb 8, 2000
Sold by
Edholm Philip K and Edholm Suzanne J
Bought by
Ju Zhengwen and Wang Yulan
Home Financials for this Owner
Home Financials are based on the most recent Mortgage that was taken out on this home.
Original Mortgage
$420,000
Interest Rate
7.62%
Create a Home Valuation Report for This Property
The Home Valuation Report is an in-depth analysis detailing your home's value as well as a comparison with similar homes in the area
Home Values in the Area
Average Home Value in this Area
Purchase History
| Date | Buyer | Sale Price | Title Company |
|---|---|---|---|
| Ju Zhengwen | -- | None Available | |
| Ju Zhengwen | -- | Chicago Title Company | |
| Ju Zhengwen | -- | North American Title Co | |
| Ju Zhengwen | $765,000 | Chicago Title Co |
Source: Public Records
Mortgage History
| Date | Status | Borrower | Loan Amount |
|---|---|---|---|
| Closed | Ju Zhengwen | $184,000 | |
| Closed | Ju Zhengwen | $300,700 | |
| Closed | Ju Zhengwen | $420,000 |
Source: Public Records
Tax History Compared to Growth
Tax History
| Year | Tax Paid | Tax Assessment Tax Assessment Total Assessment is a certain percentage of the fair market value that is determined by local assessors to be the total taxable value of land and additions on the property. | Land | Improvement |
|---|---|---|---|---|
| 2025 | $13,804 | $1,168,720 | $352,716 | $823,004 |
| 2024 | $13,804 | $1,145,670 | $345,801 | $806,869 |
| 2023 | $13,443 | $1,130,072 | $339,021 | $791,051 |
| 2022 | $13,281 | $1,100,918 | $332,375 | $775,543 |
| 2021 | $12,951 | $1,079,200 | $325,860 | $760,340 |
| 2020 | $13,028 | $1,075,068 | $322,520 | $752,548 |
| 2019 | $12,877 | $1,053,993 | $316,198 | $737,795 |
| 2018 | $12,627 | $1,033,330 | $309,999 | $723,331 |
| 2017 | $12,310 | $1,013,073 | $303,922 | $709,151 |
| 2016 | $12,107 | $993,214 | $297,964 | $695,250 |
| 2015 | $11,953 | $978,297 | $293,489 | $684,808 |
| 2014 | $11,752 | $959,133 | $287,740 | $671,393 |
Source: Public Records
Map
Nearby Homes
- 44916 Winding Ln
- 379 Felipe Common
- 45897 Bridgeport Place
- 1910 Vinehill Cir
- 130 Kootenai Dr
- 45258 Tom Blalock St Unit 100
- 1748 Kilowatt Way Unit 301
- 44423 View Point Cir
- 44989 Vista Del Sol
- 45128 Warm Springs Blvd Unit 323
- 45128 Warm Springs Blvd Unit 523
- 2250 Kilowatt Way Unit 214
- 646 Bella Vista Ct
- 46925 Aloe Ct
- 46935 Aloe Ct
- 43555 Puesta Del Sol
- 483 Becado Place
- 2450 Euclid Place
- 46762 Winema Common
- 3388 Router Common
- 44962 Naragansett Ct
- 44986 Naragansett Ct
- 211 Prairie Dog Ln
- 44950 Naragansett Ct
- 44990 Naragansett Ct
- 209 Prairie Dog Ln
- 209 Prairie Dog Ln
- 213 Prairie Dog Ln
- 44999 Naragansett Ct
- 44942 Naragansett Ct
- 44959 Washo Ct
- 44959 Washo Ct
- 44975 Naragansett Ct
- 217 Prairie Dog Ln
- 44943 Naragansett Ct
- 201 Prairie Dog Ln
- 44934 Naragansett Ct
- 44991 Naragansett Ct
- 44987 Naragansett Ct
- 223 Prairie Dog Ln