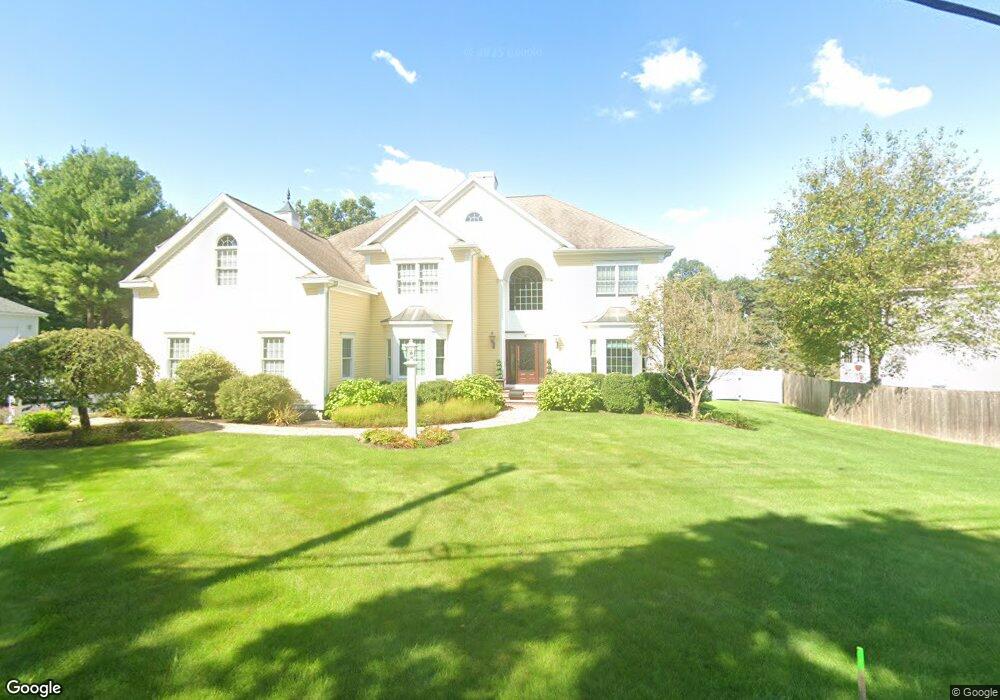
45 Argilla Rd Andover, MA 01810
West Andover NeighborhoodEstimated Value: $1,269,000 - $1,577,000
4
Beds
3
Baths
4,242
Sq Ft
$343/Sq Ft
Est. Value
About This Home
This home is located at 45 Argilla Rd, Andover, MA 01810 and is currently estimated at $1,454,867, approximately $342 per square foot. 45 Argilla Rd is a home located in Essex County with nearby schools including West Elementary School, Andover West Middle School, and Andover High School.
Ownership History
Date
Name
Owned For
Owner Type
Purchase Details
Closed on
Dec 27, 2019
Sold by
Saia Paul J and Saia Lynne A
Bought by
Saia Rt and Saia
Current Estimated Value
Purchase Details
Closed on
Feb 6, 1998
Sold by
Butler Prop Inc
Bought by
45 Argilla Road Rt
Create a Home Valuation Report for This Property
The Home Valuation Report is an in-depth analysis detailing your home's value as well as a comparison with similar homes in the area
Home Values in the Area
Average Home Value in this Area
Purchase History
| Date | Buyer | Sale Price | Title Company |
|---|---|---|---|
| Saia Rt | -- | None Available | |
| Saia Rt | -- | None Available | |
| 45 Argilla Road Rt | $183,000 | -- | |
| 45 Argilla Road Rt | $183,000 | -- |
Source: Public Records
Mortgage History
| Date | Status | Borrower | Loan Amount |
|---|---|---|---|
| Previous Owner | 45 Argilla Road Rt | $267,000 | |
| Previous Owner | 45 Argilla Road Rt | $195,000 | |
| Previous Owner | 45 Argilla Road Rt | $275,000 |
Source: Public Records
Tax History
| Year | Tax Paid | Tax Assessment Tax Assessment Total Assessment is a certain percentage of the fair market value that is determined by local assessors to be the total taxable value of land and additions on the property. | Land | Improvement |
|---|---|---|---|---|
| 2024 | $17,841 | $1,385,200 | $532,400 | $852,800 |
| 2023 | $17,138 | $1,254,600 | $479,400 | $775,200 |
| 2022 | $16,248 | $1,112,900 | $417,000 | $695,900 |
| 2021 | $15,643 | $1,023,100 | $379,100 | $644,000 |
| 2020 | $15,079 | $1,004,600 | $370,000 | $634,600 |
| 2019 | $14,713 | $963,500 | $338,100 | $625,400 |
| 2018 | $14,146 | $904,500 | $325,000 | $579,500 |
| 2017 | $13,632 | $898,000 | $318,700 | $579,300 |
| 2016 | $13,371 | $902,200 | $318,700 | $583,500 |
| 2015 | $12,885 | $860,700 | $306,500 | $554,200 |
Source: Public Records
Map
Nearby Homes
- 1 Delisio Dr
- 11 Rennie Dr
- 105 Central St
- 3 Torr St
- 241 Lowell St Unit 3
- 11 Cuba St
- 3 Caileigh Ct
- 18 Dale St Unit 9D
- 31 Porter Rd
- 96 N Main St Unit 3
- 100.5 Main St Unit Q
- 6 Exeter Way
- 37 Crenshaw Ln Unit 37
- 154 Main St
- 4 Hammond Way
- 31 Crenshaw Ln Unit 31
- 33 Chestnut St Unit 2
- 16 Porter Rd
- 54 Birch Rd
- 36 High St
Your Personal Tour Guide
Ask me questions while you tour the home.