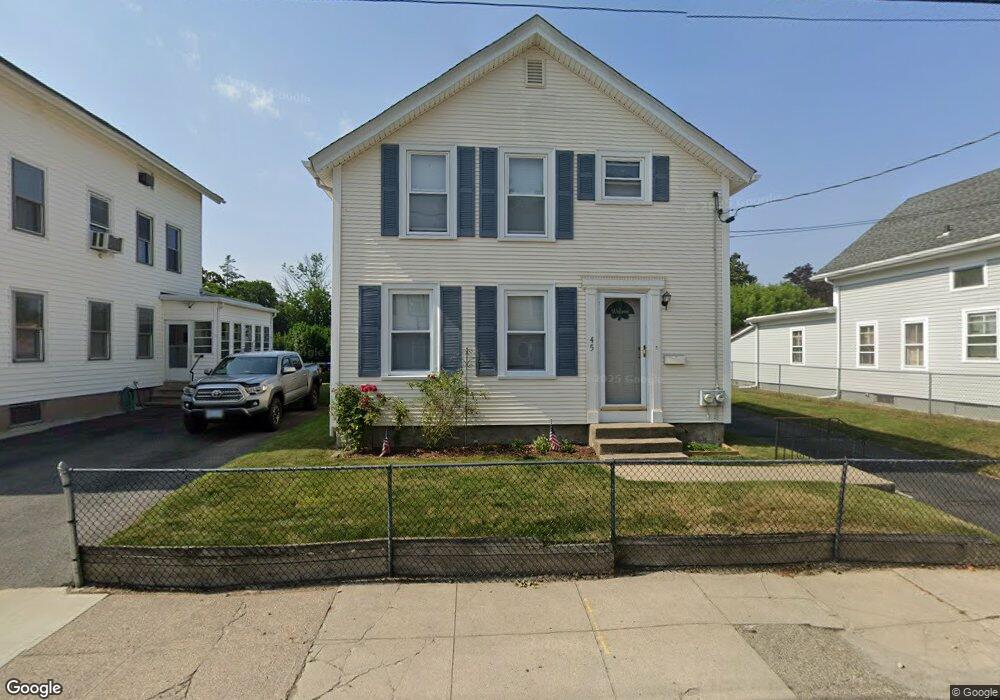
45 Bagley St Central Falls, RI 02863
Estimated Value: $240,000 - $381,000
3
Beds
2
Baths
924
Sq Ft
$355/Sq Ft
Est. Value
About This Home
This home is located at 45 Bagley St, Central Falls, RI 02863 and is currently estimated at $327,696, approximately $354 per square foot. 45 Bagley St is a home located in Providence County with nearby schools including Central Falls Senior High School and Blackstone Valley Prep Junior High School.
Ownership History
Date
Name
Owned For
Owner Type
Purchase Details
Closed on
Aug 31, 2022
Sold by
Mcgloin Brian
Bought by
Brian Mcgloin Rev Lt
Current Estimated Value
Purchase Details
Closed on
Sep 9, 2003
Sold by
Mcgloin Eleanor M
Bought by
Mcglion Brian
Home Financials for this Owner
Home Financials are based on the most recent Mortgage that was taken out on this home.
Original Mortgage
$90,000
Interest Rate
6.02%
Mortgage Type
Purchase Money Mortgage
Create a Home Valuation Report for This Property
The Home Valuation Report is an in-depth analysis detailing your home's value as well as a comparison with similar homes in the area
Home Values in the Area
Average Home Value in this Area
Purchase History
| Date | Buyer | Sale Price | Title Company |
|---|---|---|---|
| Brian Mcgloin Rev Lt | -- | None Available | |
| Mcglion Brian | $120,000 | -- |
Source: Public Records
Mortgage History
| Date | Status | Borrower | Loan Amount |
|---|---|---|---|
| Previous Owner | Mcglion Brian | $116,400 | |
| Previous Owner | Mcglion Brian | $136,500 | |
| Previous Owner | Mcglion Brian | $20,000 | |
| Previous Owner | Mcglion Brian | $90,000 |
Source: Public Records
Tax History
| Year | Tax Paid | Tax Assessment Tax Assessment Total Assessment is a certain percentage of the fair market value that is determined by local assessors to be the total taxable value of land and additions on the property. | Land | Improvement |
|---|---|---|---|---|
| 2025 | $3,822 | $289,300 | $120,000 | $169,300 |
| 2024 | $4,163 | $221,300 | $85,000 | $136,300 |
| 2023 | $4,105 | $221,300 | $85,000 | $136,300 |
| 2022 | $2,656 | $221,300 | $85,000 | $136,300 |
| 2021 | $3,032 | $127,600 | $39,300 | $88,300 |
| 2020 | $3,023 | $127,600 | $39,300 | $88,300 |
| 2019 | $3,159 | $127,600 | $39,300 | $88,300 |
| 2018 | $2,289 | $87,000 | $35,000 | $52,000 |
| 2017 | $2,289 | $87,000 | $35,000 | $52,000 |
| 2016 | $2,256 | $87,000 | $35,000 | $52,000 |
| 2015 | $2,144 | $77,600 | $35,000 | $42,600 |
| 2014 | $2,115 | $77,600 | $35,000 | $42,600 |
| 2013 | $1,996 | $77,600 | $35,000 | $42,600 |
Source: Public Records
Map
Nearby Homes
- 85 Hendricks St
- 129 Liberty St
- 722 Dexter St Unit 726
- 108 Sumner Ave
- 616 Lonsdale Ave Unit 618
- 2 Valley St
- 546 Lonsdale Ave Unit 548
- 130 Chapel St
- 66 Perry St
- 152 Washington St
- 35 Rand St
- 150 Cottage St
- 76 Sylvian St Unit 80
- 70 Lincoln Ave
- 75 Kelly St
- 17 Beecher St
- 27 Lloyd St
- 8 Arnold Ave
- 234 Central St Unit 236
- 584 Weeden St
Your Personal Tour Guide
Ask me questions while you tour the home.