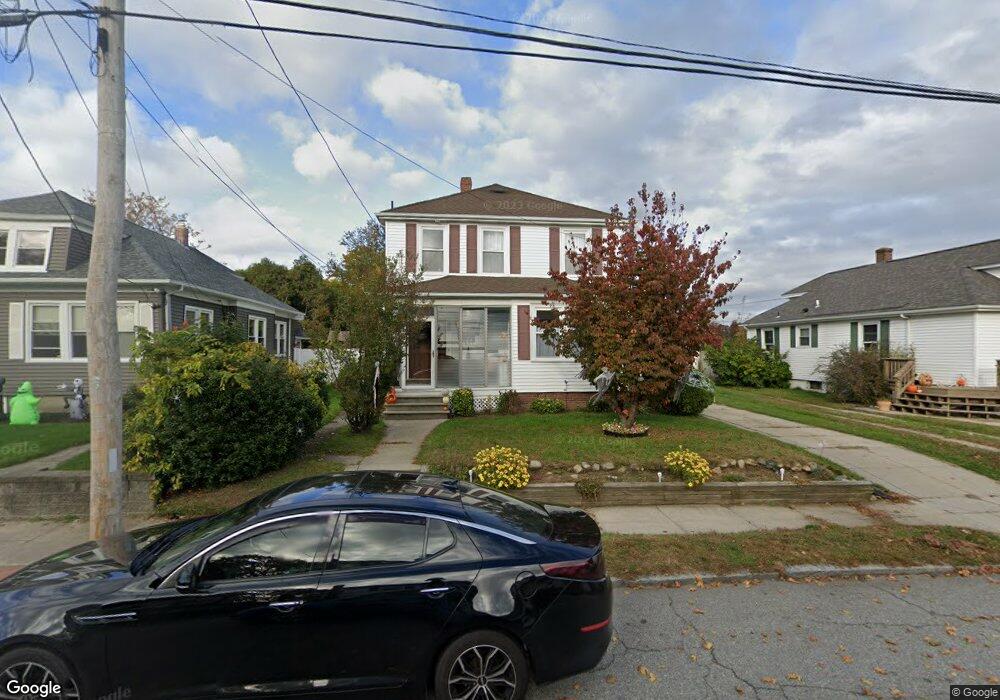
45 Calaman Rd Cranston, RI 02910
Forest Hills NeighborhoodEstimated Value: $388,836 - $438,000
3
Beds
1
Bath
1,520
Sq Ft
$274/Sq Ft
Est. Value
About This Home
This home is located at 45 Calaman Rd, Cranston, RI 02910 and is currently estimated at $415,959, approximately $273 per square foot. 45 Calaman Rd is a home located in Providence County with nearby schools including Woodridge Elementary School, Western Hills Middle School, and Cranston High School West.
Ownership History
Date
Name
Owned For
Owner Type
Purchase Details
Closed on
Jun 29, 2007
Sold by
Curran Paul and Curran Therese
Bought by
Brindale Kelly L
Current Estimated Value
Home Financials for this Owner
Home Financials are based on the most recent Mortgage that was taken out on this home.
Original Mortgage
$184,800
Outstanding Balance
$113,384
Interest Rate
6.24%
Mortgage Type
Purchase Money Mortgage
Estimated Equity
$302,575
Purchase Details
Closed on
Jun 15, 1993
Sold by
Fox Kathleen P
Bought by
Curran Paul B and Curran Theresa
Home Financials for this Owner
Home Financials are based on the most recent Mortgage that was taken out on this home.
Original Mortgage
$81,600
Interest Rate
7.41%
Create a Home Valuation Report for This Property
The Home Valuation Report is an in-depth analysis detailing your home's value as well as a comparison with similar homes in the area
Home Values in the Area
Average Home Value in this Area
Purchase History
| Date | Buyer | Sale Price | Title Company |
|---|---|---|---|
| Brindale Kelly L | $231,000 | -- | |
| Curran Paul B | $102,000 | -- |
Source: Public Records
Mortgage History
| Date | Status | Borrower | Loan Amount |
|---|---|---|---|
| Open | Curran Paul B | $184,800 | |
| Previous Owner | Curran Paul B | $32,550 | |
| Previous Owner | Curran Paul B | $123,000 | |
| Previous Owner | Curran Paul B | $81,600 |
Source: Public Records
Tax History Compared to Growth
Tax History
| Year | Tax Paid | Tax Assessment Tax Assessment Total Assessment is a certain percentage of the fair market value that is determined by local assessors to be the total taxable value of land and additions on the property. | Land | Improvement |
|---|---|---|---|---|
| 2025 | $4,315 | $310,900 | $106,900 | $204,000 |
| 2024 | $4,231 | $310,900 | $106,900 | $204,000 |
| 2023 | $4,069 | $215,300 | $70,400 | $144,900 |
| 2022 | $3,985 | $215,300 | $70,400 | $144,900 |
| 2021 | $3,875 | $215,300 | $70,400 | $144,900 |
| 2020 | $3,818 | $183,800 | $67,000 | $116,800 |
| 2019 | $3,818 | $183,800 | $67,000 | $116,800 |
| 2018 | $3,729 | $183,800 | $67,000 | $116,800 |
| 2017 | $3,634 | $158,400 | $60,300 | $98,100 |
| 2016 | $3,556 | $158,400 | $60,300 | $98,100 |
| 2015 | $3,556 | $158,400 | $60,300 | $98,100 |
| 2014 | $3,648 | $159,700 | $60,300 | $99,400 |
Source: Public Records
Map
Nearby Homes
- 12 Stevens Rd
- 130 Wollaston St
- 129 Wollaston St
- 115 Norfolk St
- 140 Concord Ave
- 51 Norfolk St
- 74 Leslie St
- 55 Columbus Blvd
- 75 High School Ave
- 140 Eldridge St
- 46 Roslyn Ave
- 210 Crescent Ave
- 1 Rolfe Square
- 36 Blackamore Ave
- 63 Packard St
- 136 Frankfort St
- 80 Packard St
- 166 Midwood St
- 483 Pontiac Ave
- 128 Elsie St