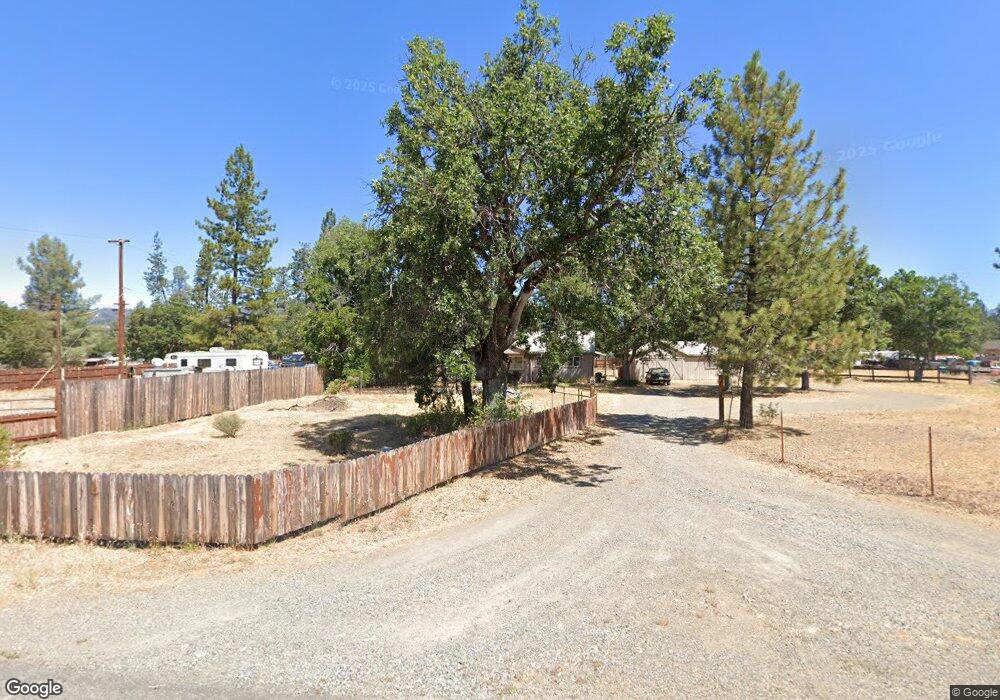
45 Center St Hayfork, CA 96041
Estimated Value: $153,000 - $305,706
2
Beds
2
Baths
856
Sq Ft
$251/Sq Ft
Est. Value
About This Home
This home is located at 45 Center St, Hayfork, CA 96041 and is currently estimated at $214,677, approximately $250 per square foot. 45 Center St is a home with nearby schools including Hayfork High School.
Ownership History
Date
Name
Owned For
Owner Type
Purchase Details
Closed on
Jul 15, 2016
Sold by
Balbini Ossie J and Balbini Ossie J
Bought by
Balbini Ossie J
Current Estimated Value
Purchase Details
Closed on
Dec 29, 2014
Sold by
Wharton Patricia J
Bought by
Balbini Ssie J
Purchase Details
Closed on
Dec 21, 2007
Sold by
Balbini Ossie J and Balbini Ossie
Bought by
Balbini Ossie J
Purchase Details
Closed on
Sep 28, 2007
Sold by
Bjork Shelley
Bought by
Balbini Ossie J and Wharton Patricia J
Home Financials for this Owner
Home Financials are based on the most recent Mortgage that was taken out on this home.
Original Mortgage
$50,000
Interest Rate
6.46%
Mortgage Type
Purchase Money Mortgage
Purchase Details
Closed on
Mar 14, 2003
Sold by
Dunaetz Charlene
Bought by
Bjork Shelley
Create a Home Valuation Report for This Property
The Home Valuation Report is an in-depth analysis detailing your home's value as well as a comparison with similar homes in the area
Home Values in the Area
Average Home Value in this Area
Purchase History
| Date | Buyer | Sale Price | Title Company |
|---|---|---|---|
| Balbini Ossie J | -- | None Available | |
| Balbini Ssie J | -- | None Available | |
| Balbini Ossie J | -- | None Available | |
| Balbini Ossie J | $125,000 | Trinity Co Title Co | |
| Bjork Shelley | $87,000 | First American Title Co |
Source: Public Records
Mortgage History
| Date | Status | Borrower | Loan Amount |
|---|---|---|---|
| Previous Owner | Balbini Ossie J | $50,000 |
Source: Public Records
Tax History
| Year | Tax Paid | Tax Assessment Tax Assessment Total Assessment is a certain percentage of the fair market value that is determined by local assessors to be the total taxable value of land and additions on the property. | Land | Improvement |
|---|---|---|---|---|
| 2025 | $2,922 | $239,292 | $83,232 | $156,060 |
| 2024 | $2,885 | $234,600 | $81,600 | $153,000 |
| 2023 | $2,885 | $230,000 | $80,000 | $150,000 |
| 2022 | $2,094 | $155,112 | $62,286 | $92,826 |
| 2021 | $1,923 | $152,071 | $61,065 | $91,006 |
| 2020 | $1,879 | $150,512 | $60,439 | $90,073 |
| 2019 | $1,847 | $147,561 | $59,254 | $88,307 |
| 2018 | $1,802 | $144,669 | $58,093 | $86,576 |
| 2017 | $1,798 | $141,833 | $56,954 | $84,879 |
| 2016 | $1,752 | $139,053 | $55,838 | $83,215 |
| 2015 | $1,734 | $136,966 | $55,000 | $81,966 |
| 2014 | $1,712 | $133,931 | $53,572 | $80,359 |
Source: Public Records
Map
Nearby Homes
- 305 Pine Ave
- 355 Pine Ave
- 1240 Morgan Hill Rd
- 820 Kingsbury Rd
- 134 W Humboldt St
- 134 Humboldt St
- 63 Michel St
- 7020 California 3
- 70 Oak Ave
- 7021 California 3
- 310 Reservoir Rd
- 71 Tule Creek Rd
- 20 Genest St
- 675 Hyampom
- 125 Cedar Gulch Rd
- 355 Oliva Dr
- 347 Buck Ln
- 341 Buck Ln
- 1095 Hyampom Rd
- 480 Oliva Dr
Your Personal Tour Guide
Ask me questions while you tour the home.