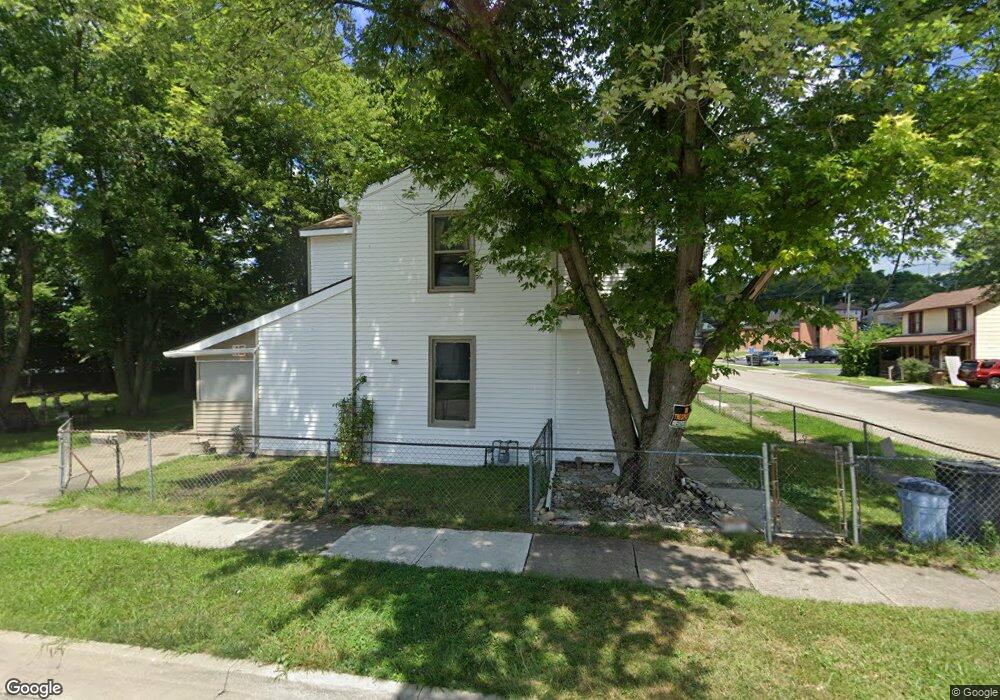
45 E 5th St Franklin, OH 45005
Estimated Value: $126,000 - $169,000
3
Beds
2
Baths
1,464
Sq Ft
$100/Sq Ft
Est. Value
About This Home
This home is located at 45 E 5th St, Franklin, OH 45005 and is currently estimated at $146,696, approximately $100 per square foot. 45 E 5th St is a home located in Warren County with nearby schools including Franklin High School.
Ownership History
Date
Name
Owned For
Owner Type
Purchase Details
Closed on
May 8, 2020
Sold by
Huddleston Bruce L and Huddleston Ellen E
Bought by
Posey Earnest P
Current Estimated Value
Purchase Details
Closed on
Oct 27, 2011
Sold by
Huddleston Bruce L and Huddleston Ellen E
Bought by
Posey Ernest P
Home Financials for this Owner
Home Financials are based on the most recent Mortgage that was taken out on this home.
Original Mortgage
$48,000
Interest Rate
6.5%
Mortgage Type
Seller Take Back
Purchase Details
Closed on
Sep 28, 1988
Sold by
Collier Collier and Collier Calvin
Bought by
Huddleston Huddleston and Huddleston Bruce L
Purchase Details
Closed on
Apr 5, 1985
Sold by
Collier Thomas P and Collier Thomas P
Bought by
Collier and Collier Calvin
Purchase Details
Closed on
Jun 20, 1984
Sold by
Lillie Collier and Lillie S.
Bought by
Thomas Collier and Thomas P.
Create a Home Valuation Report for This Property
The Home Valuation Report is an in-depth analysis detailing your home's value as well as a comparison with similar homes in the area
Home Values in the Area
Average Home Value in this Area
Purchase History
| Date | Buyer | Sale Price | Title Company |
|---|---|---|---|
| Posey Earnest P | $49,500 | None Available | |
| Posey Ernest P | $49,500 | None Available | |
| Huddleston Huddleston | $22,500 | -- | |
| Collier | -- | -- | |
| Thomas Collier | -- | -- |
Source: Public Records
Mortgage History
| Date | Status | Borrower | Loan Amount |
|---|---|---|---|
| Previous Owner | Posey Ernest P | $48,000 |
Source: Public Records
Tax History
| Year | Tax Paid | Tax Assessment Tax Assessment Total Assessment is a certain percentage of the fair market value that is determined by local assessors to be the total taxable value of land and additions on the property. | Land | Improvement |
|---|---|---|---|---|
| 2025 | $1,051 | $22,350 | $8,630 | $13,720 |
| 2024 | $1,051 | $22,350 | $8,630 | $13,720 |
| 2023 | $846 | $16,124 | $4,896 | $11,228 |
| 2022 | $830 | $16,125 | $4,897 | $11,228 |
| 2021 | $787 | $16,125 | $4,897 | $11,228 |
| 2020 | $845 | $14,956 | $3,885 | $11,071 |
| 2019 | $770 | $14,956 | $3,885 | $11,071 |
| 2018 | $772 | $14,956 | $3,885 | $11,071 |
| 2017 | $798 | $14,154 | $3,731 | $10,423 |
| 2016 | $813 | $14,154 | $3,731 | $10,423 |
| 2015 | $813 | $14,154 | $3,731 | $10,423 |
| 2014 | $834 | $14,150 | $3,730 | $10,420 |
| 2013 | $710 | $16,380 | $4,320 | $12,060 |
Source: Public Records
Map
Nearby Homes
- 0 E 4th St
- 1200 Riley Blvd
- 627 S River St
- 202 E 2nd St
- 309 Oxford Rd
- 210 N Riley Blvd
- 218 Roberts Ave
- 205 Oxford Rd
- 410 Park Ave
- 388 Thomas Dr
- 509 Forest Ave
- 511 Forest Ave
- 551 E 2nd St
- 413 Spring Ave
- 1117 S Main St
- 0 Victoria Dr Unit 942075
- 0 Victoria Dr Unit 1852824
- 16 Harding Ct
- 228 Bridge St
- 651 E 2nd St