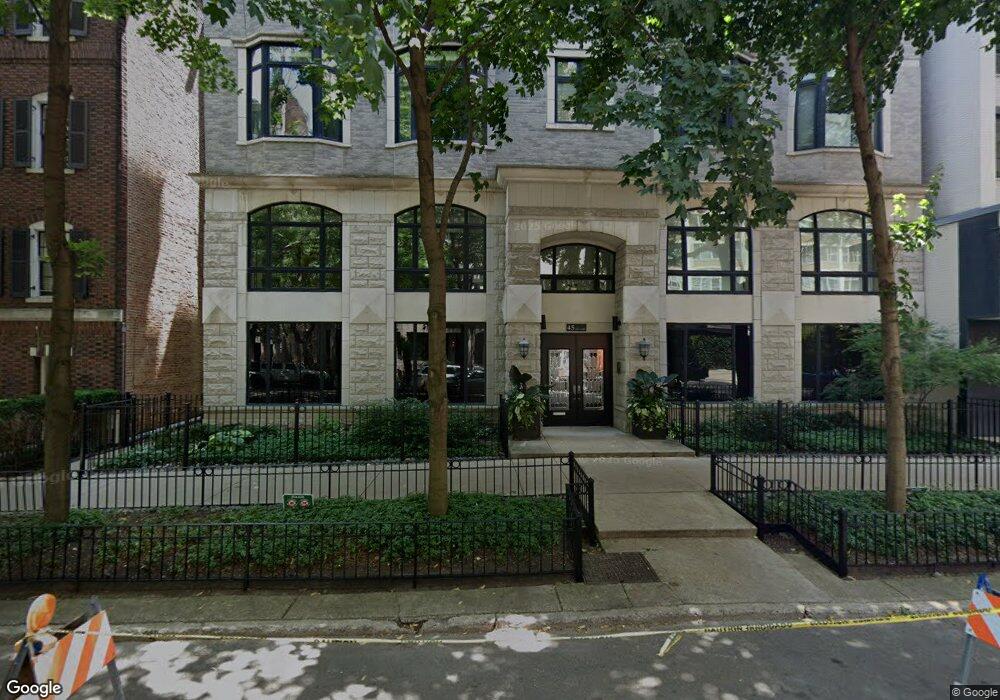
45 E Cedar St Unit 300 Chicago, IL 60611
Gold Coast NeighborhoodEstimated Value: $687,511 - $944,000
3
Beds
3
Baths
3,000
Sq Ft
$280/Sq Ft
Est. Value
About This Home
This home is located at 45 E Cedar St Unit 300, Chicago, IL 60611 and is currently estimated at $840,504, approximately $280 per square foot. 45 E Cedar St Unit 300 is a home located in Cook County with nearby schools including Ogden Elementary School, Lincoln Park High School, and Frances Xavier Warde School.
Ownership History
Date
Name
Owned For
Owner Type
Purchase Details
Closed on
Jan 4, 2024
Sold by
Suzanne Tadin Irrevocable Family Trust
Bought by
Tadin Suzanne
Current Estimated Value
Purchase Details
Closed on
Jun 18, 2012
Sold by
Chicago Title Land Trust Company
Bought by
Jpmorgan Chase Bank Na and Suzanne M Tadin Irrevocable Family Trust
Purchase Details
Closed on
Jun 23, 1998
Sold by
Lakeside Bank
Bought by
American National Bk & Tr Co Of Chicago and Trust #124233-07
Purchase Details
Closed on
Jul 30, 1997
Sold by
Lasalle National Bank
Bought by
Lakeside Bank and Trust #10-1869
Purchase Details
Closed on
Oct 31, 1994
Sold by
Angelos Mychal P and Toscas Merry
Bought by
Lasalle National Trust Na
Purchase Details
Closed on
Oct 27, 1994
Sold by
Maywood Proviso State Bank
Bought by
Angelos Mychal P and Toscas Merry
Create a Home Valuation Report for This Property
The Home Valuation Report is an in-depth analysis detailing your home's value as well as a comparison with similar homes in the area
Home Values in the Area
Average Home Value in this Area
Purchase History
| Date | Buyer | Sale Price | Title Company |
|---|---|---|---|
| Tadin Suzanne | -- | None Listed On Document | |
| Jpmorgan Chase Bank Na | -- | Chicago Title Land Trust Co | |
| American National Bk & Tr Co Of Chicago | -- | -- | |
| Lakeside Bank | $206,666 | -- | |
| Lasalle National Trust Na | $925,000 | -- | |
| Angelos Mychal P | -- | -- |
Source: Public Records
Tax History
| Year | Tax Paid | Tax Assessment Tax Assessment Total Assessment is a certain percentage of the fair market value that is determined by local assessors to be the total taxable value of land and additions on the property. | Land | Improvement |
|---|---|---|---|---|
| 2025 | $10,483 | $75,500 | $39,666 | $35,834 |
| 2024 | $10,483 | $75,500 | $39,666 | $35,834 |
| 2023 | $10,198 | $53,000 | $26,500 | $26,500 |
| 2022 | $10,198 | $53,000 | $26,500 | $26,500 |
| 2021 | $9,988 | $53,000 | $26,500 | $26,500 |
| 2020 | $23,972 | $110,710 | $22,356 | $88,354 |
| 2019 | $23,448 | $120,138 | $22,356 | $97,782 |
| 2018 | $23,053 | $120,138 | $22,356 | $97,782 |
| 2017 | $24,124 | $115,438 | $17,885 | $97,553 |
| 2016 | $22,621 | $115,438 | $17,885 | $97,553 |
| 2015 | $20,673 | $115,438 | $17,885 | $97,553 |
| 2014 | $20,790 | $114,619 | $14,371 | $100,248 |
| 2013 | $20,368 | $114,619 | $14,371 | $100,248 |
Source: Public Records
Map
Nearby Homes
- 33 E Cedar St Unit 15F
- 33 E Cedar St Unit 7D
- 45 E Cedar St Unit 200
- 50 E Bellevue Place Unit 1504
- 20 E Cedar St Unit 8B
- 37 E Elm St
- 41 E Elm St
- 73 E Elm St Unit 12D
- 73 E Elm St Unit 7B
- 73 E Elm St Unit 4B
- 100 E Bellevue Place Unit 23B
- 30 E Elm St Unit 20G
- 4 E Elm St Unit 12S
- 1100 N Lake Shore Dr Unit 11B
- 1100 N Lake Shore Dr Unit 7B
- 53 E Division St
- 1120 N Lake Shore Dr Unit 18CD
- 1120 N Lake Shore Dr Unit 15A
- 1110 N Lake Shore Dr Unit 20S
- 1120 N Lake Shore Dr Unit 10C
- 45 E Cedar St Unit 400
- 45 E Cedar St Unit 500
- 49 E Cedar St Unit 1
- 49 E Cedar St Unit 4
- 49 E Cedar St Unit 3
- 49 E Cedar St Unit 5
- 49 E Cedar St Unit 2
- 49 E Cedar St
- 50 E Bellevue Place Unit 1105-06
- 50 E Bellevue Place Unit 802
- 50 E Bellevue Place Unit 1105
- 50 E Bellevue Place Unit 701
- 50 E Bellevue Place Unit 1705
- 50 E Bellevue Place Unit 2703
- 50 E Bellevue Place Unit 401
- 50 E Bellevue Place Unit 2005
- 50 E Bellevue Place Unit 505
- 50 E Bellevue Place Unit 2203
- 50 E Bellevue Place Unit 2406
- 50 E Bellevue Place Unit 1306
Your Personal Tour Guide
Ask me questions while you tour the home.