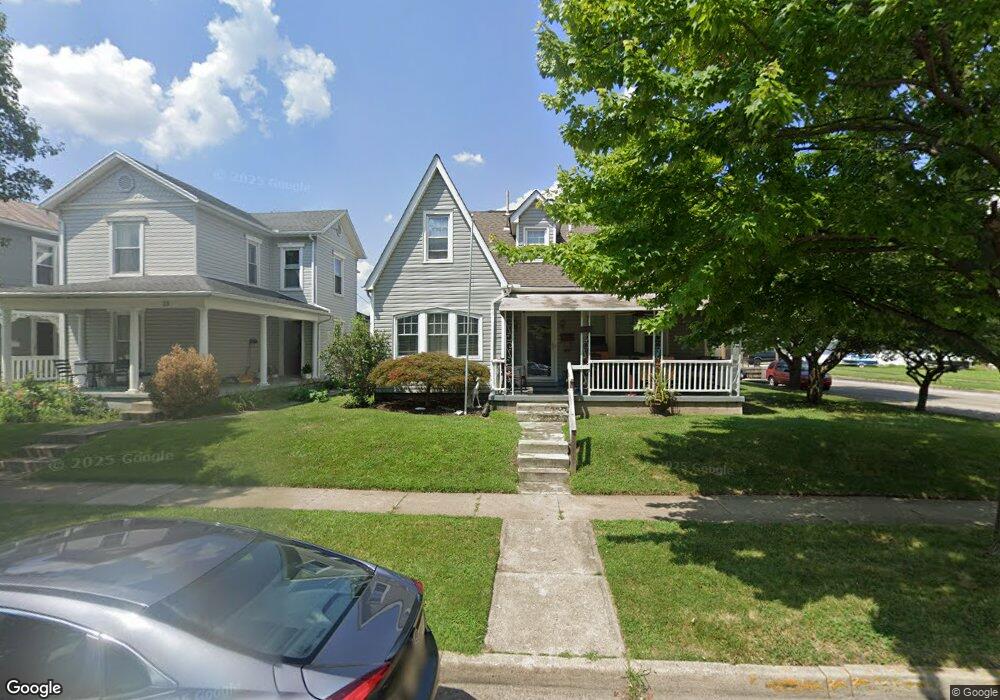
45 E Main St West Carrollton, OH 45449
Estimated Value: $177,000 - $214,000
3
Beds
2
Baths
1,544
Sq Ft
$127/Sq Ft
Est. Value
About This Home
This home is located at 45 E Main St, West Carrollton, OH 45449 and is currently estimated at $195,503, approximately $126 per square foot. 45 E Main St is a home located in Montgomery County with nearby schools including West Carrollton High School, Miami Valley Academies, and Bethel Baptist School.
Ownership History
Date
Name
Owned For
Owner Type
Purchase Details
Closed on
Feb 17, 2017
Sold by
Jones Rebecca A
Bought by
Jones Roy E
Current Estimated Value
Home Financials for this Owner
Home Financials are based on the most recent Mortgage that was taken out on this home.
Original Mortgage
$91,700
Outstanding Balance
$75,199
Interest Rate
4.12%
Mortgage Type
New Conventional
Estimated Equity
$120,304
Purchase Details
Closed on
May 7, 2009
Sold by
Holloway Jimmy and Holloway Anna Lucille
Bought by
Jones Rebecca A
Home Financials for this Owner
Home Financials are based on the most recent Mortgage that was taken out on this home.
Original Mortgage
$99,170
Interest Rate
4.83%
Mortgage Type
FHA
Purchase Details
Closed on
Apr 14, 2006
Sold by
Holloway Jimmy and Holloway Lucille
Bought by
Holloway Jimmy and Holloway Anna Lucille
Purchase Details
Closed on
Jul 29, 2005
Sold by
Yordy Charles S and Yordy Joan
Bought by
Holloway Jimmy and Holloway Lucille
Create a Home Valuation Report for This Property
The Home Valuation Report is an in-depth analysis detailing your home's value as well as a comparison with similar homes in the area
Home Values in the Area
Average Home Value in this Area
Purchase History
| Date | Buyer | Sale Price | Title Company |
|---|---|---|---|
| Jones Roy E | $100,000 | M&M Title Co | |
| Jones Rebecca A | $101,000 | Republic Title Agency Inc | |
| Holloway Jimmy | -- | Attorney | |
| Holloway Jimmy | $107,000 | -- |
Source: Public Records
Mortgage History
| Date | Status | Borrower | Loan Amount |
|---|---|---|---|
| Open | Jones Roy E | $91,700 | |
| Previous Owner | Jones Rebecca A | $99,170 |
Source: Public Records
Tax History
| Year | Tax Paid | Tax Assessment Tax Assessment Total Assessment is a certain percentage of the fair market value that is determined by local assessors to be the total taxable value of land and additions on the property. | Land | Improvement |
|---|---|---|---|---|
| 2025 | $3,405 | $51,090 | $8,750 | $42,340 |
| 2024 | $3,214 | $51,090 | $8,750 | $42,340 |
| 2023 | $3,214 | $51,090 | $8,750 | $42,340 |
| 2022 | $2,934 | $36,010 | $6,160 | $29,850 |
| 2021 | $2,938 | $36,010 | $6,160 | $29,850 |
| 2020 | $2,939 | $36,010 | $6,160 | $29,850 |
| 2019 | $2,696 | $30,330 | $5,600 | $24,730 |
| 2018 | $2,533 | $30,330 | $5,600 | $24,730 |
| 2017 | $2,575 | $30,330 | $5,600 | $24,730 |
| 2016 | $2,560 | $29,410 | $5,600 | $23,810 |
| 2015 | $2,367 | $29,410 | $5,600 | $23,810 |
| 2014 | $2,367 | $29,410 | $5,600 | $23,810 |
| 2012 | -- | $28,830 | $5,600 | $23,230 |
Source: Public Records
Map
Nearby Homes
- 12 E Main St
- 33 E Cottage Ave
- 209 E Cottage Ave
- 316 E Pease Ave
- 345 E Central Ave
- 9 W Lowery Ave
- 201 S Smith St
- 113 Savoy Ave
- 428 E Cottage Ave
- 217 E Home Ave
- 509 Windsor Ave
- 322 Savoy Ave
- 518 Regal Ave
- 232 Tulip Dr
- 1133 Primrose Dr
- 192 Golfwood Dr
- 1037 Primrose Dr
- 11 Airstream Dr
- 96 Airstream Dr
- 1000 Skyview Dr
Your Personal Tour Guide
Ask me questions while you tour the home.