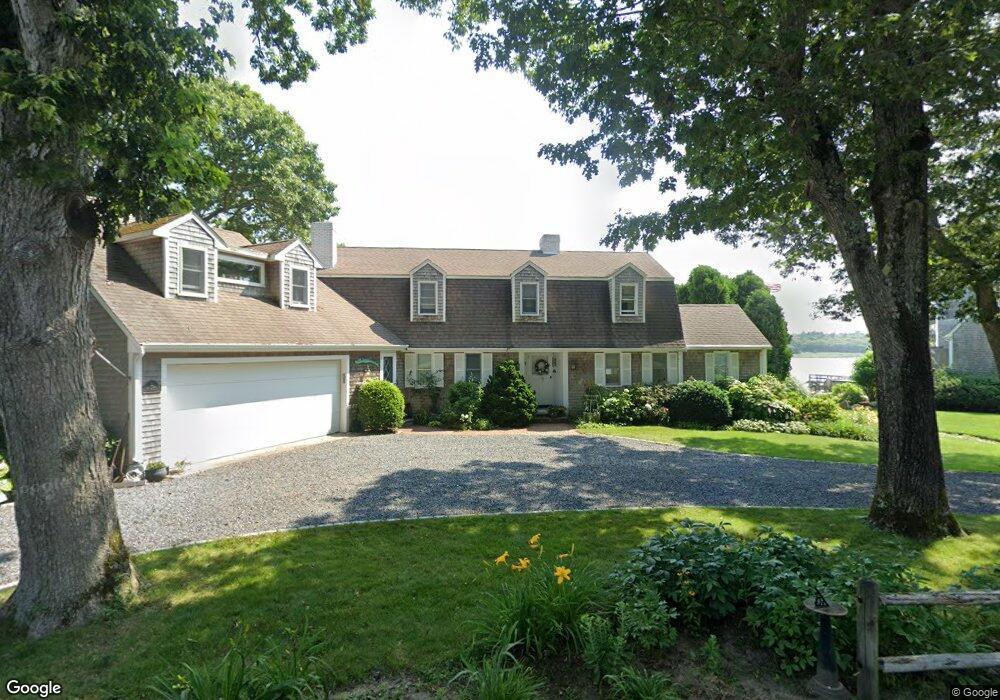
45 East Ave Marion, MA 02738
Estimated Value: $2,466,508 - $3,106,000
3
Beds
4
Baths
3,854
Sq Ft
$723/Sq Ft
Est. Value
About This Home
This home is located at 45 East Ave, Marion, MA 02738 and is currently estimated at $2,784,627, approximately $722 per square foot. 45 East Ave is a home located in Plymouth County with nearby schools including Old Rochester Regional High School.
Ownership History
Date
Name
Owned For
Owner Type
Purchase Details
Closed on
Nov 29, 2021
Sold by
J P & M N Sarson Marion Nt and Sarson
Bought by
Sarson John P and Sarson Marguerite N
Current Estimated Value
Home Financials for this Owner
Home Financials are based on the most recent Mortgage that was taken out on this home.
Original Mortgage
$599,000
Interest Rate
4.16%
Mortgage Type
New Conventional
Purchase Details
Closed on
Apr 21, 2005
Sold by
Sarson John P and Sarson Marguerite N
Bought by
Sarson John P and Sarson Marguerite N
Purchase Details
Closed on
Nov 25, 1998
Sold by
Forte Orville W
Bought by
Sarson John P and Sarson Marguerite N
Home Financials for this Owner
Home Financials are based on the most recent Mortgage that was taken out on this home.
Original Mortgage
$400,000
Interest Rate
6.83%
Mortgage Type
Purchase Money Mortgage
Purchase Details
Closed on
Sep 8, 1992
Sold by
Pyle Jerry H and Pyle Cynthia M
Bought by
Forte Orville W
Create a Home Valuation Report for This Property
The Home Valuation Report is an in-depth analysis detailing your home's value as well as a comparison with similar homes in the area
Home Values in the Area
Average Home Value in this Area
Purchase History
| Date | Buyer | Sale Price | Title Company |
|---|---|---|---|
| Sarson John P | -- | None Available | |
| Sarson John P | -- | None Available | |
| Sarson John P | -- | -- | |
| Sarson John P | -- | -- | |
| Sarson John P | $800,000 | -- | |
| Forte Orville W | $625,000 | -- |
Source: Public Records
Mortgage History
| Date | Status | Borrower | Loan Amount |
|---|---|---|---|
| Previous Owner | Sarson John P | $599,000 | |
| Previous Owner | Forte Orville W | $400,000 |
Source: Public Records
Tax History Compared to Growth
Tax History
| Year | Tax Paid | Tax Assessment Tax Assessment Total Assessment is a certain percentage of the fair market value that is determined by local assessors to be the total taxable value of land and additions on the property. | Land | Improvement |
|---|---|---|---|---|
| 2025 | $20,096 | $2,156,235 | $1,371,435 | $784,800 |
| 2024 | $18,762 | $2,026,082 | $1,252,182 | $773,900 |
| 2023 | $16,957 | $1,796,310 | $1,076,610 | $719,700 |
| 2022 | $19,608 | $1,807,229 | $1,198,129 | $609,100 |
| 2021 | $19,164 | $1,692,943 | $1,127,143 | $565,800 |
| 2020 | $16,447 | $1,405,700 | $899,700 | $506,000 |
| 2019 | $14,619 | $1,325,400 | $819,400 | $506,000 |
| 2018 | $15,593 | $1,361,800 | $891,100 | $470,700 |
| 2017 | $15,289 | $1,340,000 | $891,100 | $448,900 |
| 2016 | $15,279 | $1,350,900 | $891,100 | $459,800 |
| 2015 | $15,470 | $1,392,400 | $954,400 | $438,000 |
Source: Public Records
Map
Nearby Homes