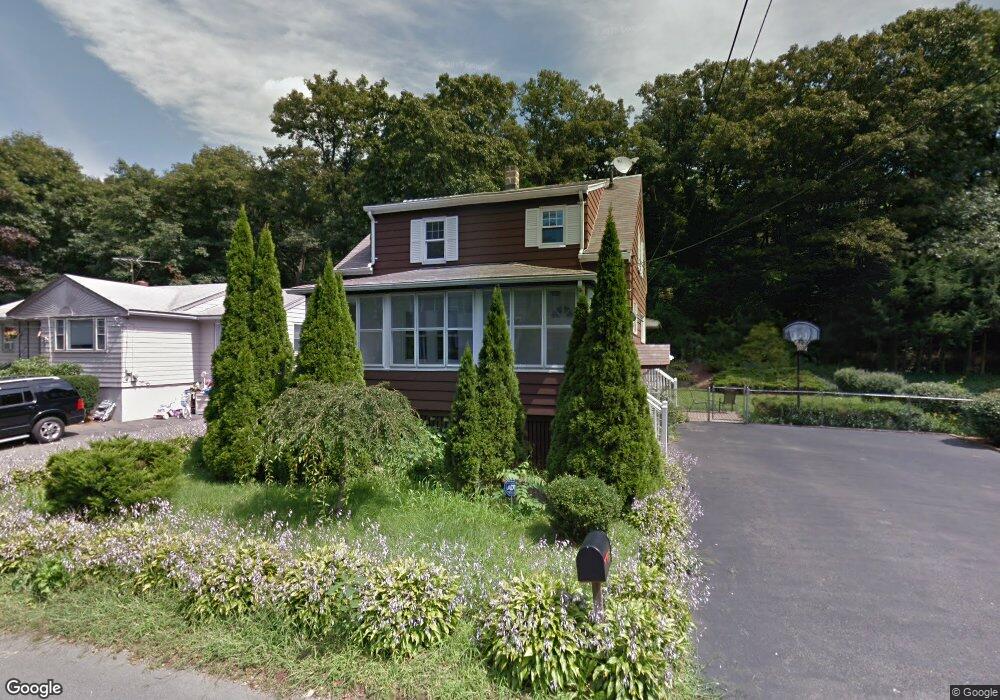
45 Hesper St Saugus, MA 01906
Lynnhurst NeighborhoodEstimated Value: $587,592 - $661,000
3
Beds
2
Baths
1,421
Sq Ft
$439/Sq Ft
Est. Value
About This Home
This home is located at 45 Hesper St, Saugus, MA 01906 and is currently estimated at $623,898, approximately $439 per square foot. 45 Hesper St is a home located in Essex County with nearby schools including Saugus High School, Pioneer Charter School Of Science II, and Sacred Heart School.
Ownership History
Date
Name
Owned For
Owner Type
Purchase Details
Closed on
Jul 7, 2011
Sold by
Butts Lori
Bought by
Bruno Gloria K and Bruno Ken J
Current Estimated Value
Home Financials for this Owner
Home Financials are based on the most recent Mortgage that was taken out on this home.
Original Mortgage
$241,530
Interest Rate
4.6%
Mortgage Type
Purchase Money Mortgage
Purchase Details
Closed on
Apr 11, 2007
Sold by
Butts Helen R and Butts John R
Bought by
Butts Lori
Create a Home Valuation Report for This Property
The Home Valuation Report is an in-depth analysis detailing your home's value as well as a comparison with similar homes in the area
Home Values in the Area
Average Home Value in this Area
Purchase History
| Date | Buyer | Sale Price | Title Company |
|---|---|---|---|
| Bruno Gloria K | $249,000 | -- | |
| Butts Lori | -- | -- |
Source: Public Records
Mortgage History
| Date | Status | Borrower | Loan Amount |
|---|---|---|---|
| Open | Butts Lori | $220,500 | |
| Closed | Butts Lori | $241,530 | |
| Previous Owner | Butts Lori | $10,000 |
Source: Public Records
Tax History
| Year | Tax Paid | Tax Assessment Tax Assessment Total Assessment is a certain percentage of the fair market value that is determined by local assessors to be the total taxable value of land and additions on the property. | Land | Improvement |
|---|---|---|---|---|
| 2025 | $5,684 | $532,200 | $327,900 | $204,300 |
| 2024 | $5,534 | $519,600 | $319,100 | $200,500 |
| 2023 | $5,343 | $474,500 | $279,200 | $195,300 |
| 2022 | $5,194 | $432,500 | $259,700 | $172,800 |
| 2021 | $4,640 | $376,000 | $215,400 | $160,600 |
| 2020 | $4,354 | $365,300 | $204,700 | $160,600 |
| 2019 | $4,331 | $355,600 | $195,000 | $160,600 |
| 2018 | $3,916 | $338,200 | $186,100 | $152,100 |
| 2017 | $3,722 | $308,900 | $177,300 | $131,600 |
| 2016 | $3,196 | $262,000 | $168,400 | $93,600 |
| 2015 | $2,999 | $249,500 | $160,400 | $89,100 |
| 2014 | $2,958 | $254,800 | $160,400 | $94,400 |
Source: Public Records
Map
Nearby Homes
- 52 Hesper St
- 67 Saville St
- 4 Oneil Way
- 36 Jasper St
- 25 Auburn St
- 43 Taylor St
- 24 Palmetto St
- 34 Summer St
- 187 Hamilton St
- 43 W Sigourney St
- 7 Adams Ave
- 7 Nirvana Dr
- 22 Susan Dr
- 57 Vine St
- 21 Fenton Ave
- 29 Susan Dr
- 32 Birch Brook Landing Unit 23
- 32 Birch Brook Landing Unit 25
- 32 Birch Brook Landing Unit 22
- 32 Birch Brook Rd Unit 13
Your Personal Tour Guide
Ask me questions while you tour the home.