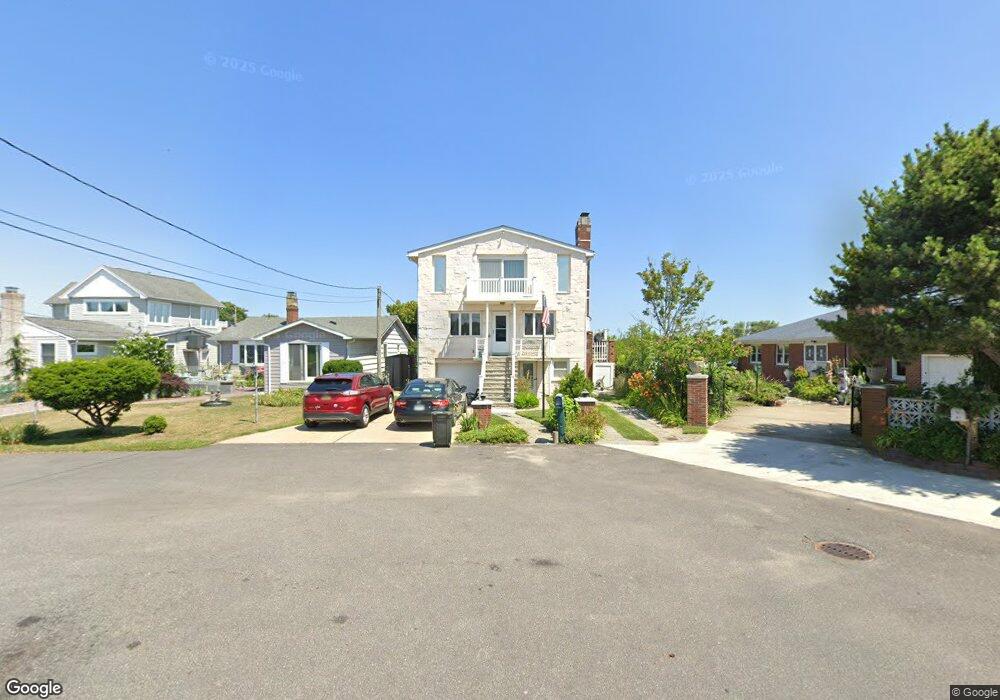
45 Lyndale Ct Shirley, NY 11967
Estimated Value: $561,000 - $718,000
5
Beds
2
Baths
2,777
Sq Ft
$225/Sq Ft
Est. Value
About This Home
This home is located at 45 Lyndale Ct, Shirley, NY 11967 and is currently estimated at $624,710, approximately $224 per square foot. 45 Lyndale Ct is a home located in Suffolk County with nearby schools including John S. Hobart Elementary School, William Paca Middle School, and William Floyd High School.
Ownership History
Date
Name
Owned For
Owner Type
Purchase Details
Closed on
Mar 17, 2004
Sold by
Taibi Robert and Taibi Armenuyi
Bought by
Ehatt Peter J and Ehatt Jean M
Current Estimated Value
Home Financials for this Owner
Home Financials are based on the most recent Mortgage that was taken out on this home.
Original Mortgage
$273,000
Outstanding Balance
$127,409
Interest Rate
5.65%
Mortgage Type
Purchase Money Mortgage
Estimated Equity
$497,301
Purchase Details
Closed on
May 9, 2001
Sold by
Mansolino Matteo
Bought by
Taibi Robert and Taibi Armenuyi
Create a Home Valuation Report for This Property
The Home Valuation Report is an in-depth analysis detailing your home's value as well as a comparison with similar homes in the area
Home Values in the Area
Average Home Value in this Area
Purchase History
| Date | Buyer | Sale Price | Title Company |
|---|---|---|---|
| Ehatt Peter J | $455,000 | -- | |
| Taibi Robert | $247,000 | -- |
Source: Public Records
Mortgage History
| Date | Status | Borrower | Loan Amount |
|---|---|---|---|
| Open | Ehatt Peter J | $273,000 |
Source: Public Records
Tax History Compared to Growth
Tax History
| Year | Tax Paid | Tax Assessment Tax Assessment Total Assessment is a certain percentage of the fair market value that is determined by local assessors to be the total taxable value of land and additions on the property. | Land | Improvement |
|---|---|---|---|---|
| 2024 | $10,049 | $2,800 | $280 | $2,520 |
| 2023 | $10,049 | $2,800 | $280 | $2,520 |
| 2022 | $10,547 | $2,800 | $280 | $2,520 |
| 2021 | $10,547 | $2,800 | $280 | $2,520 |
| 2020 | $10,850 | $2,800 | $280 | $2,520 |
| 2019 | $10,850 | $0 | $0 | $0 |
| 2018 | $10,238 | $2,800 | $280 | $2,520 |
| 2017 | $10,238 | $2,800 | $280 | $2,520 |
| 2016 | $10,181 | $2,800 | $280 | $2,520 |
| 2015 | -- | $3,400 | $280 | $3,120 |
| 2014 | -- | $3,400 | $280 | $3,120 |
Source: Public Records
Map
Nearby Homes