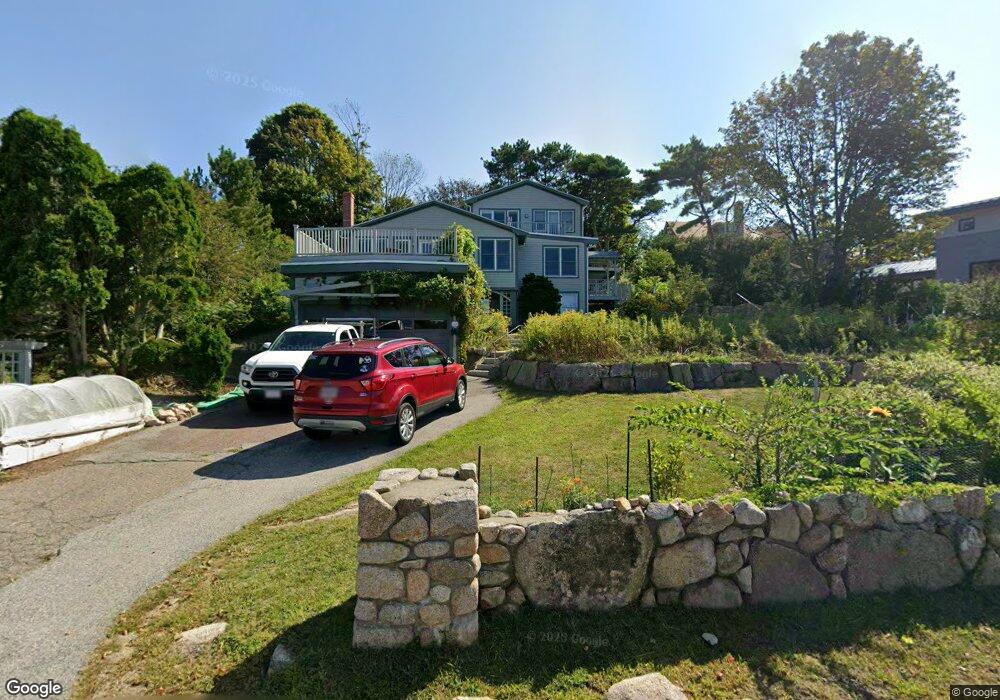
45 Shore Rd Gloucester, MA 01930
Magnolia NeighborhoodEstimated Value: $713,000 - $2,277,000
1
Bed
1
Bath
1,779
Sq Ft
$908/Sq Ft
Est. Value
About This Home
This home is located at 45 Shore Rd, Gloucester, MA 01930 and is currently estimated at $1,615,828, approximately $908 per square foot. 45 Shore Rd is a home located in Essex County with nearby schools including West Parish, Ralph B O'maley Middle School, and Gloucester High School.
Ownership History
Date
Name
Owned For
Owner Type
Purchase Details
Closed on
Jul 20, 1999
Sold by
Bornstein Bruce A
Bought by
Kriebel David and Quinn Margaret M
Current Estimated Value
Home Financials for this Owner
Home Financials are based on the most recent Mortgage that was taken out on this home.
Original Mortgage
$336,000
Outstanding Balance
$92,853
Interest Rate
7.39%
Mortgage Type
Purchase Money Mortgage
Estimated Equity
$1,522,975
Purchase Details
Closed on
May 2, 1997
Sold by
Gayron Margaret M
Bought by
Bornstein Bruce A
Home Financials for this Owner
Home Financials are based on the most recent Mortgage that was taken out on this home.
Original Mortgage
$125,000
Interest Rate
7.85%
Mortgage Type
Purchase Money Mortgage
Create a Home Valuation Report for This Property
The Home Valuation Report is an in-depth analysis detailing your home's value as well as a comparison with similar homes in the area
Home Values in the Area
Average Home Value in this Area
Purchase History
| Date | Buyer | Sale Price | Title Company |
|---|---|---|---|
| Kriebel David | $420,000 | -- | |
| Bornstein Bruce A | $272,900 | -- |
Source: Public Records
Mortgage History
| Date | Status | Borrower | Loan Amount |
|---|---|---|---|
| Open | Bornstein Bruce A | $100,000 | |
| Open | Kriebel David | $336,000 | |
| Previous Owner | Bornstein Bruce A | $125,000 | |
| Closed | Kriebel David | $42,000 |
Source: Public Records
Tax History
| Year | Tax Paid | Tax Assessment Tax Assessment Total Assessment is a certain percentage of the fair market value that is determined by local assessors to be the total taxable value of land and additions on the property. | Land | Improvement |
|---|---|---|---|---|
| 2025 | $15,766 | $1,622,000 | $1,062,800 | $559,200 |
| 2024 | $15,459 | $1,588,800 | $1,012,100 | $576,700 |
| 2023 | $14,373 | $1,357,200 | $863,500 | $493,700 |
| 2022 | $13,629 | $1,161,900 | $751,300 | $410,600 |
| 2021 | $13,256 | $1,065,600 | $682,600 | $383,000 |
| 2020 | $12,882 | $1,044,800 | $682,600 | $362,200 |
| 2019 | $12,827 | $1,010,800 | $650,900 | $359,900 |
| 2018 | $12,488 | $965,800 | $635,000 | $330,800 |
| 2017 | $11,942 | $905,400 | $604,500 | $300,900 |
| 2016 | $11,684 | $858,500 | $577,900 | $280,600 |
| 2015 | $11,244 | $823,700 | $564,800 | $258,900 |
Source: Public Records
Map
Nearby Homes
- 53 Raymond St
- 2 Ocean Ave Unit 2K
- 24 Flume Rd
- 468 Summer St
- 450 Summer St
- 239 Summer St
- 8 Forest St
- 4 Cobb Ave
- 25 Masconomo St
- 6 Smith Ln Unit 6
- 45 School St
- 8 Flatley Ave
- 100 Eastern Point Blvd
- 5 Marshfield St
- 368 Essex Ave
- 26 Central St
- 21 Pine St Unit 5
- 5 Lepage Ln
- 24 Cobblestone Ln Unit 603
- 5 Samoset Rd Unit B
Your Personal Tour Guide
Ask me questions while you tour the home.