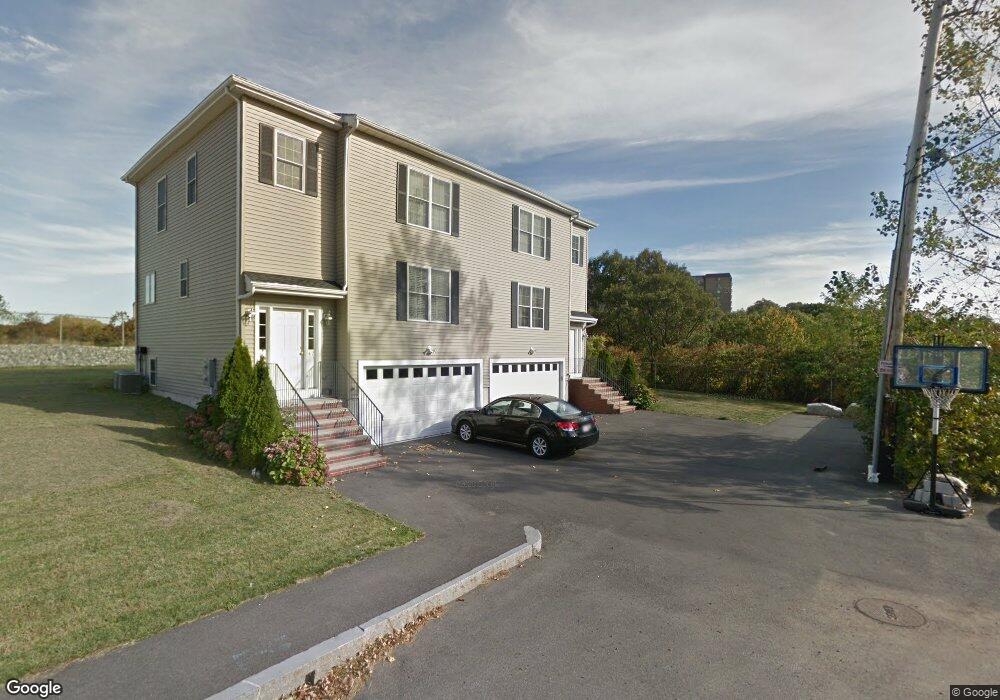
45 Summit St Unit 47 Malden, MA 02148
Maplewood Highlands NeighborhoodEstimated Value: $728,470 - $933,000
3
Beds
3
Baths
2,592
Sq Ft
$321/Sq Ft
Est. Value
About This Home
This home is located at 45 Summit St Unit 47, Malden, MA 02148 and is currently estimated at $831,868, approximately $320 per square foot. 45 Summit St Unit 47 is a home located in Middlesex County with nearby schools including Malden High School, Cheverus Catholic School, and Malden Catholic.
Ownership History
Date
Name
Owned For
Owner Type
Purchase Details
Closed on
Mar 24, 2015
Sold by
Dandridge Rt and Dandridge Mira B
Bought by
Dandridge Ft and Dandridge Mira B
Current Estimated Value
Home Financials for this Owner
Home Financials are based on the most recent Mortgage that was taken out on this home.
Original Mortgage
$293,000
Outstanding Balance
$218,642
Interest Rate
3%
Mortgage Type
Adjustable Rate Mortgage/ARM
Estimated Equity
$613,226
Purchase Details
Closed on
Jan 5, 2012
Sold by
Dandridge Mira B
Bought by
Dandridge Rt and Dandridge Mira B
Purchase Details
Closed on
Mar 1, 2010
Sold by
Mgmt Giannelli and Cor Ev
Bought by
Dandridge Mira B
Home Financials for this Owner
Home Financials are based on the most recent Mortgage that was taken out on this home.
Original Mortgage
$337,950
Interest Rate
5.11%
Mortgage Type
Purchase Money Mortgage
Create a Home Valuation Report for This Property
The Home Valuation Report is an in-depth analysis detailing your home's value as well as a comparison with similar homes in the area
Home Values in the Area
Average Home Value in this Area
Purchase History
| Date | Buyer | Sale Price | Title Company |
|---|---|---|---|
| Dandridge Ft | -- | -- | |
| Dandridge Rt | -- | -- | |
| Dandridge Mira B | $375,500 | -- |
Source: Public Records
Mortgage History
| Date | Status | Borrower | Loan Amount |
|---|---|---|---|
| Open | Dandridge Ft | $293,000 | |
| Previous Owner | Dandridge Mira B | $337,950 |
Source: Public Records
Tax History Compared to Growth
Tax History
| Year | Tax Paid | Tax Assessment Tax Assessment Total Assessment is a certain percentage of the fair market value that is determined by local assessors to be the total taxable value of land and additions on the property. | Land | Improvement |
|---|---|---|---|---|
| 2025 | $71 | $626,700 | $0 | $626,700 |
| 2024 | $6,780 | $580,000 | $0 | $580,000 |
| 2023 | $6,861 | $562,800 | $0 | $562,800 |
| 2022 | $6,376 | $516,300 | $0 | $516,300 |
| 2021 | $6,174 | $502,400 | $0 | $502,400 |
| 2020 | $6,271 | $495,700 | $0 | $495,700 |
| 2019 | $5,995 | $451,800 | $0 | $451,800 |
| 2018 | $6,004 | $426,100 | $0 | $426,100 |
| 2017 | $5,594 | $394,800 | $0 | $394,800 |
| 2016 | $5,746 | $379,000 | $0 | $379,000 |
| 2015 | $5,551 | $352,900 | $0 | $352,900 |
| 2014 | $5,682 | $352,900 | $0 | $352,900 |
Source: Public Records
Map
Nearby Homes