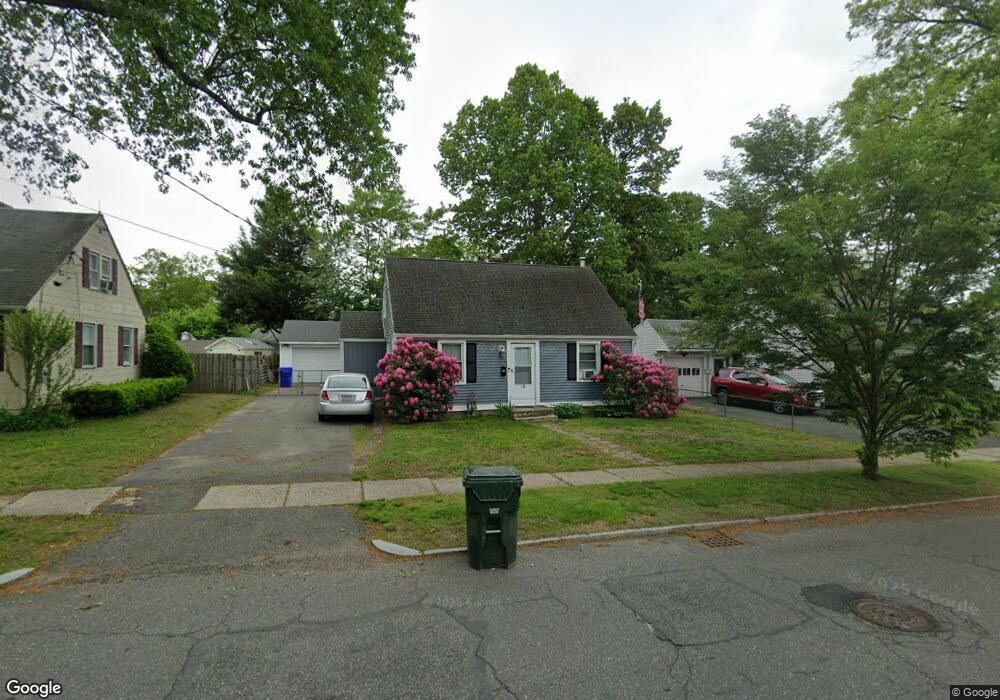
45 Surrey Rd Springfield, MA 01118
East Forest Park NeighborhoodEstimated Value: $271,000 - $299,000
4
Beds
1
Bath
1,008
Sq Ft
$281/Sq Ft
Est. Value
About This Home
This home is located at 45 Surrey Rd, Springfield, MA 01118 and is currently estimated at $282,993, approximately $280 per square foot. 45 Surrey Rd is a home located in Hampden County with nearby schools including Mary A. Dryden Veterans Memorial School, M Marcus Kiley Middle, and Springfield High School of Science and Technology.
Ownership History
Date
Name
Owned For
Owner Type
Purchase Details
Closed on
Mar 28, 2000
Sold by
Stpierre Leon T
Bought by
Rheaume Glen Edward
Current Estimated Value
Home Financials for this Owner
Home Financials are based on the most recent Mortgage that was taken out on this home.
Original Mortgage
$91,800
Outstanding Balance
$31,631
Interest Rate
8.31%
Mortgage Type
Purchase Money Mortgage
Estimated Equity
$251,362
Create a Home Valuation Report for This Property
The Home Valuation Report is an in-depth analysis detailing your home's value as well as a comparison with similar homes in the area
Home Values in the Area
Average Home Value in this Area
Purchase History
| Date | Buyer | Sale Price | Title Company |
|---|---|---|---|
| Rheaume Glen Edward | $45,000 | -- | |
| Rheaume Glen Edward | $45,000 | -- |
Source: Public Records
Mortgage History
| Date | Status | Borrower | Loan Amount |
|---|---|---|---|
| Open | Rheaume Glen Edward | $91,800 |
Source: Public Records
Tax History Compared to Growth
Tax History
| Year | Tax Paid | Tax Assessment Tax Assessment Total Assessment is a certain percentage of the fair market value that is determined by local assessors to be the total taxable value of land and additions on the property. | Land | Improvement |
|---|---|---|---|---|
| 2025 | $3,393 | $216,400 | $46,800 | $169,600 |
| 2024 | $3,122 | $194,400 | $46,800 | $147,600 |
| 2023 | $2,936 | $172,200 | $44,600 | $127,600 |
| 2022 | $3,019 | $160,400 | $44,600 | $115,800 |
| 2021 | $2,982 | $157,800 | $40,500 | $117,300 |
| 2020 | $2,933 | $150,200 | $40,500 | $109,700 |
| 2019 | $2,673 | $135,800 | $40,500 | $95,300 |
| 2018 | $2,464 | $125,200 | $40,500 | $84,700 |
| 2017 | $2,454 | $124,800 | $40,500 | $84,300 |
| 2016 | $2,143 | $109,000 | $40,500 | $68,500 |
| 2015 | $2,093 | $106,400 | $40,500 | $65,900 |
Source: Public Records
Map
Nearby Homes