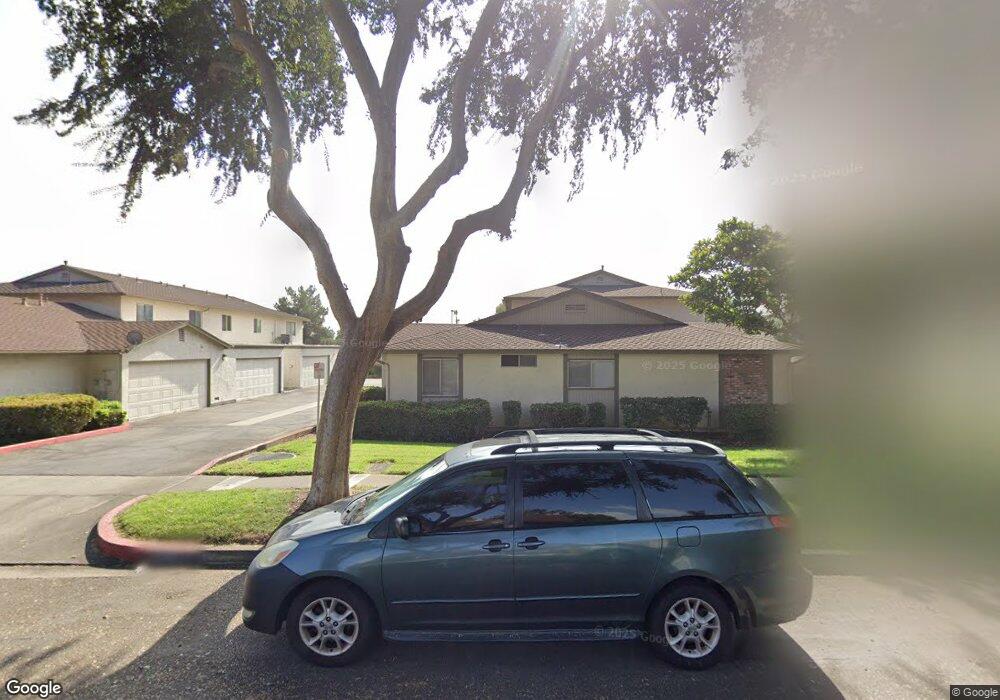
450 D St Unit 17 Upland, CA 91786
Estimated Value: $458,034 - $534,000
2
Beds
2
Baths
1,155
Sq Ft
$424/Sq Ft
Est. Value
About This Home
This home is located at 450 D St Unit 17, Upland, CA 91786 and is currently estimated at $490,009, approximately $424 per square foot. 450 D St Unit 17 is a home located in San Bernardino County with nearby schools including Upland Elementary School, Upland Junior High School, and Upland High School.
Ownership History
Date
Name
Owned For
Owner Type
Purchase Details
Closed on
Oct 19, 2005
Sold by
Legters David J
Bought by
Legters David J and David J Legters Trust
Current Estimated Value
Purchase Details
Closed on
Apr 9, 2003
Sold by
Werhane Gail L
Bought by
Werhane Gilmore C
Home Financials for this Owner
Home Financials are based on the most recent Mortgage that was taken out on this home.
Original Mortgage
$116,000
Outstanding Balance
$46,604
Interest Rate
4.87%
Mortgage Type
Purchase Money Mortgage
Estimated Equity
$443,405
Purchase Details
Closed on
Apr 1, 2003
Sold by
Werhane Gilmore C
Bought by
Legters David J and Legters Derek J
Home Financials for this Owner
Home Financials are based on the most recent Mortgage that was taken out on this home.
Original Mortgage
$116,000
Outstanding Balance
$46,604
Interest Rate
4.87%
Mortgage Type
Purchase Money Mortgage
Estimated Equity
$443,405
Create a Home Valuation Report for This Property
The Home Valuation Report is an in-depth analysis detailing your home's value as well as a comparison with similar homes in the area
Home Values in the Area
Average Home Value in this Area
Purchase History
| Date | Buyer | Sale Price | Title Company |
|---|---|---|---|
| Legters David J | -- | -- | |
| Werhane Gilmore C | -- | First American | |
| Legters David J | $145,000 | First American |
Source: Public Records
Mortgage History
| Date | Status | Borrower | Loan Amount |
|---|---|---|---|
| Open | Legters David J | $116,000 |
Source: Public Records
Tax History
| Year | Tax Paid | Tax Assessment Tax Assessment Total Assessment is a certain percentage of the fair market value that is determined by local assessors to be the total taxable value of land and additions on the property. | Land | Improvement |
|---|---|---|---|---|
| 2025 | $2,453 | $210,011 | $73,504 | $136,507 |
| 2024 | $2,376 | $205,893 | $72,063 | $133,830 |
| 2023 | $2,339 | $201,856 | $70,650 | $131,206 |
| 2022 | $2,288 | $197,898 | $69,265 | $128,633 |
| 2021 | $2,283 | $194,018 | $67,907 | $126,111 |
| 2020 | $2,221 | $192,029 | $67,211 | $124,818 |
| 2019 | $2,214 | $188,264 | $65,893 | $122,371 |
| 2018 | $2,162 | $184,573 | $64,601 | $119,972 |
| 2017 | $2,100 | $180,954 | $63,334 | $117,620 |
| 2016 | $1,922 | $177,406 | $62,092 | $115,314 |
| 2015 | $1,878 | $174,741 | $61,159 | $113,582 |
| 2014 | $1,830 | $171,318 | $59,961 | $111,357 |
Source: Public Records
Map
Nearby Homes
Your Personal Tour Guide
Ask me questions while you tour the home.