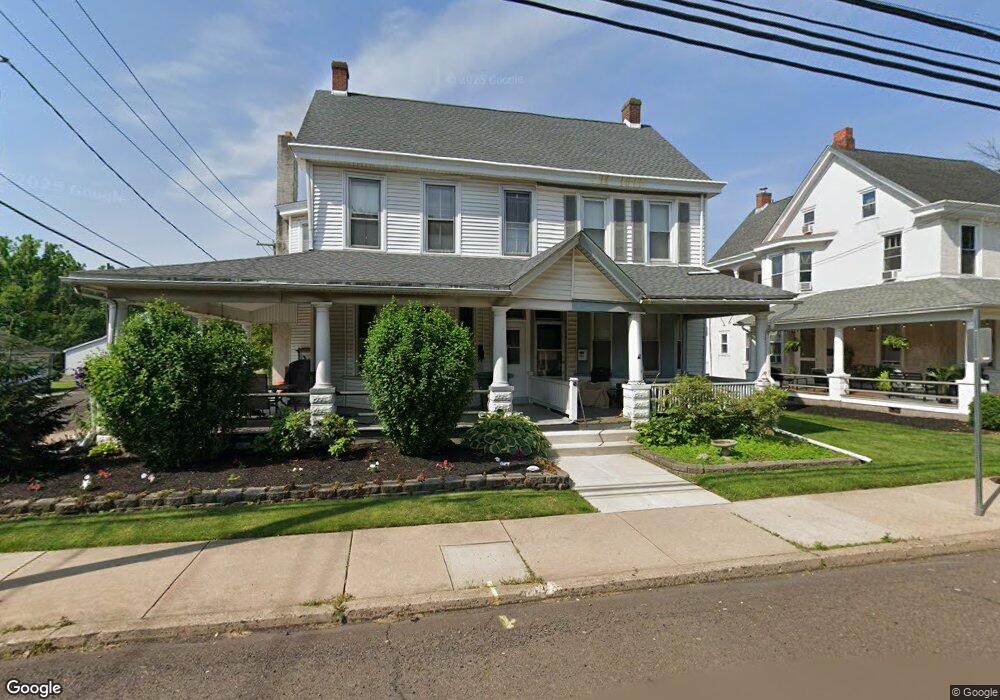
450 E Walnut St Perkasie, PA 18944
East Rockhill NeighborhoodEstimated Value: $296,000 - $350,000
3
Beds
1
Bath
1,476
Sq Ft
$212/Sq Ft
Est. Value
About This Home
This home is located at 450 E Walnut St, Perkasie, PA 18944 and is currently estimated at $313,326, approximately $212 per square foot. 450 E Walnut St is a home located in Bucks County with nearby schools including Pennridge High School, Faith Christain Academy Lower, and Community Service Foundation.
Ownership History
Date
Name
Owned For
Owner Type
Purchase Details
Closed on
Feb 28, 2011
Sold by
Allen Bruce C
Bought by
Arnold Thomas A and Costea Janice E
Current Estimated Value
Home Financials for this Owner
Home Financials are based on the most recent Mortgage that was taken out on this home.
Original Mortgage
$165,796
Outstanding Balance
$113,757
Interest Rate
4.76%
Mortgage Type
New Conventional
Estimated Equity
$199,569
Purchase Details
Closed on
Apr 4, 2003
Sold by
Thompson Marc A
Bought by
Allen Bruce C
Purchase Details
Closed on
Nov 24, 2000
Sold by
Thompson Marc A and Grandzol Maureen
Bought by
Thompson Marc A
Home Financials for this Owner
Home Financials are based on the most recent Mortgage that was taken out on this home.
Original Mortgage
$100,250
Interest Rate
7.7%
Purchase Details
Closed on
Aug 25, 1995
Sold by
Myers Rodney and Myers Jacqueline
Bought by
Thompson Marc and Grandzol Maureen
Home Financials for this Owner
Home Financials are based on the most recent Mortgage that was taken out on this home.
Original Mortgage
$99,900
Interest Rate
7.61%
Create a Home Valuation Report for This Property
The Home Valuation Report is an in-depth analysis detailing your home's value as well as a comparison with similar homes in the area
Home Values in the Area
Average Home Value in this Area
Purchase History
| Date | Buyer | Sale Price | Title Company |
|---|---|---|---|
| Arnold Thomas A | $160,000 | None Available | |
| Allen Bruce C | $147,000 | -- | |
| Thompson Marc A | -- | First American Title Ins Co | |
| Thompson Marc | $103,000 | -- |
Source: Public Records
Mortgage History
| Date | Status | Borrower | Loan Amount |
|---|---|---|---|
| Open | Arnold Thomas A | $165,796 | |
| Previous Owner | Thompson Marc A | $100,250 | |
| Previous Owner | Thompson Marc | $99,900 |
Source: Public Records
Tax History
| Year | Tax Paid | Tax Assessment Tax Assessment Total Assessment is a certain percentage of the fair market value that is determined by local assessors to be the total taxable value of land and additions on the property. | Land | Improvement |
|---|---|---|---|---|
| 2025 | $2,614 | $15,200 | $2,120 | $13,080 |
| 2024 | $2,614 | $15,200 | $2,120 | $13,080 |
| 2023 | $2,583 | $15,200 | $2,120 | $13,080 |
| 2022 | $2,583 | $15,200 | $2,120 | $13,080 |
| 2021 | $2,538 | $15,200 | $2,120 | $13,080 |
| 2020 | $2,538 | $15,200 | $2,120 | $13,080 |
| 2019 | $2,523 | $15,200 | $2,120 | $13,080 |
| 2018 | $2,523 | $15,200 | $2,120 | $13,080 |
| 2017 | $2,504 | $15,200 | $2,120 | $13,080 |
| 2016 | $2,504 | $15,200 | $2,120 | $13,080 |
| 2015 | -- | $15,200 | $2,120 | $13,080 |
| 2014 | -- | $15,200 | $2,120 | $13,080 |
Source: Public Records
Map
Nearby Homes
- 135 Sugarbush Dr
- 11B Fairview Ave
- 412 Grandview Ave
- 322 Kent Ln
- 439 Brookside Dr
- 30 S 2nd St
- 311 W Walnut St
- 258 N 4th St
- 121 Steeple Bush Dr
- 512 Mews Dr Unit 512
- 510 S 5th St
- 155 Hampshire Dr
- 46 N 8th St Unit HOMESITE B23
- 40 N 8th St Unit HOMESITE B20
- 50 N 8th St Unit HOMESITE B25
- 52 N 8th St Unit HOMESITE B26
- 54 N 8th St Unit HOMESITE B27
- 109 Unami Way
- 111 Unami Way
- 0042 Baldwin Way
- 452 E Walnut St
- 446 E Walnut St
- 504 E Walnut St
- 500 E Walnut St Unit 4
- 500 E Walnut St Unit 3
- 436 E Walnut St Unit B
- 436 E Walnut St Unit A
- 436 E Walnut St
- 453 E Walnut St
- 502 E Walnut St
- 200 S Main St
- 457 E Walnut St
- 455 E Walnut St
- 156 S Main St Unit Victorian Charm1
- 156 S Main St Unit Victorian 2
- 156 S Main St
- 420 E Walnut St
- 433 E Walnut St
- 503 E Walnut St
- 427 E Walnut St
Your Personal Tour Guide
Ask me questions while you tour the home.