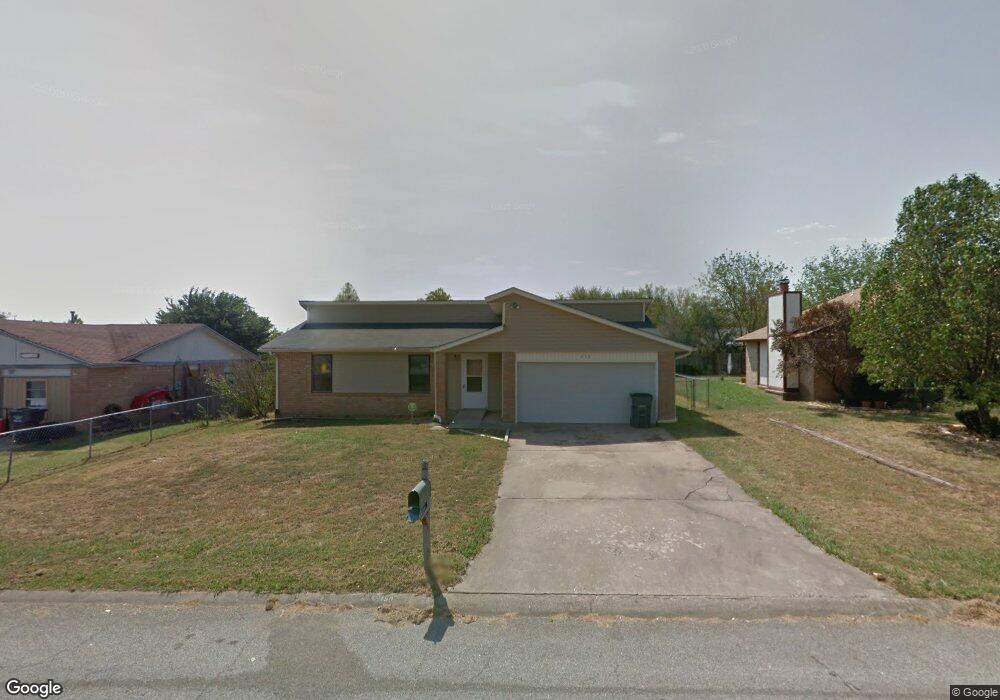
450 W 146th Place Glenpool, OK 74033
Estimated Value: $184,000 - $190,000
3
Beds
1
Bath
1,213
Sq Ft
$154/Sq Ft
Est. Value
About This Home
This home is located at 450 W 146th Place, Glenpool, OK 74033 and is currently estimated at $186,521, approximately $153 per square foot. 450 W 146th Place is a home located in Tulsa County with nearby schools including Glenpool Elementary School, Glenpool Middle School, and Glenpool High School.
Ownership History
Date
Name
Owned For
Owner Type
Purchase Details
Closed on
Jun 10, 2011
Sold by
Federal Home Loan Mortgage Corporation
Bought by
Bahnmaier Michael R
Current Estimated Value
Purchase Details
Closed on
Oct 7, 2010
Sold by
Daves Erin R
Bought by
Federal Home Loan Mortgage Corp
Purchase Details
Closed on
May 18, 2007
Sold by
Fuss Diana and Fuss Diana Lynn
Bought by
Daves Erin R
Home Financials for this Owner
Home Financials are based on the most recent Mortgage that was taken out on this home.
Original Mortgage
$87,499
Interest Rate
6.17%
Mortgage Type
Unknown
Purchase Details
Closed on
Aug 26, 1999
Sold by
Fuss Robert L and Fuss Diana
Bought by
Fuss Robert L and Fuss Diana
Purchase Details
Closed on
Jul 14, 1999
Sold by
Umholtz Joshua L and Umholtz Malinda D
Bought by
Fuss Robert L and Fuss Diana
Purchase Details
Closed on
Jan 1, 1995
Create a Home Valuation Report for This Property
The Home Valuation Report is an in-depth analysis detailing your home's value as well as a comparison with similar homes in the area
Home Values in the Area
Average Home Value in this Area
Purchase History
| Date | Buyer | Sale Price | Title Company |
|---|---|---|---|
| Bahnmaier Michael R | -- | The Oklahoma City Abstract & | |
| Federal Home Loan Mortgage Corp | -- | None Available | |
| Daves Erin R | $87,500 | None Available | |
| Fuss Robert L | -- | -- | |
| Fuss Robert L | $58,333 | Tulsa Abstract & Title Co | |
| -- | $53,000 | -- |
Source: Public Records
Mortgage History
| Date | Status | Borrower | Loan Amount |
|---|---|---|---|
| Previous Owner | Daves Erin R | $87,499 |
Source: Public Records
Tax History Compared to Growth
Tax History
| Year | Tax Paid | Tax Assessment Tax Assessment Total Assessment is a certain percentage of the fair market value that is determined by local assessors to be the total taxable value of land and additions on the property. | Land | Improvement |
|---|---|---|---|---|
| 2025 | $1,612 | $13,445 | $1,432 | $12,013 |
| 2024 | $1,428 | $12,804 | $1,639 | $11,165 |
| 2023 | $1,428 | $12,194 | $1,675 | $10,519 |
| 2022 | $1,339 | $11,614 | $2,177 | $9,437 |
| 2021 | $1,294 | $11,061 | $2,073 | $8,988 |
| 2020 | $1,304 | $11,061 | $2,073 | $8,988 |
| 2019 | $1,280 | $10,783 | $2,021 | $8,762 |
| 2018 | $1,214 | $10,270 | $1,925 | $8,345 |
| 2017 | $1,188 | $10,270 | $1,925 | $8,345 |
| 2016 | $1,181 | $10,106 | $1,894 | $8,212 |
| 2015 | $1,119 | $9,625 | $1,804 | $7,821 |
| 2014 | $1,124 | $9,625 | $1,804 | $7,821 |
Source: Public Records
Map
Nearby Homes
- 467 W 147th Place S
- 14603 S Xenophon Ave
- 571 W 149th Place
- 41 E 148th St
- 803 W 150th St
- 13708 S Elwood Ave
- 14336 S Barber St
- 14772 S Fern Place
- 14760 S Fern Place
- 14785 S Fern Place
- 14812 S Fern Place
- 15375 S 26th West Ave
- 394 E 147th St S
- 14910 S Sequoia St
- 14920 S Sequoia St
- 687 E 142nd Place
- 663 E 148th Place S
- 668 E 148th Place S
- 650 E 149th St S
- 667 E 149th St S
- 462 W 146th Place S
- 424 W 146th Place
- 462 W 146th Place
- 451 W 147th St
- 423 W 147th St
- 463 W 147th St
- 494 W 146th Place
- 404 W 146th Place
- 14641 S Waco Ave
- 495 W 147th St
- 14682 S Vancouver Ave
- 401 W 146th Place
- 512 W 146th Place
- 14631 S Waco Ave
- 14646 S Waco Ave
- 511 W 147th St S
- 511 W 147th St
- 14648 S Vancouver Ave
- 534 W 146th Place S
- 534 W 146th Place