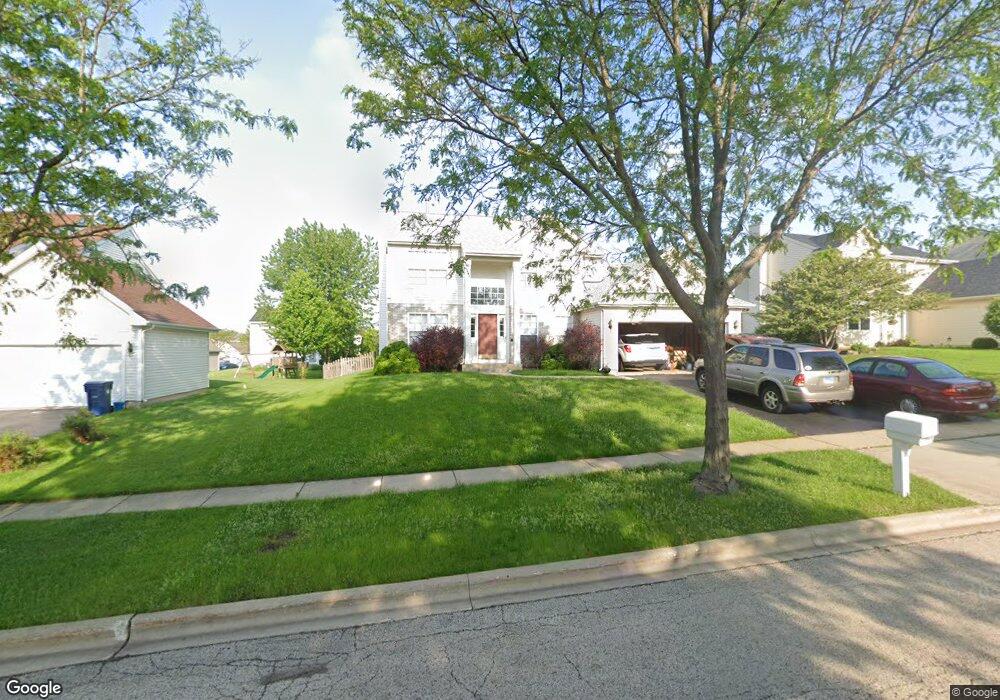
450 Winding Canyon Way Algonquin, IL 60102
Estimated Value: $384,906 - $415,000
3
Beds
--
Bath
1,822
Sq Ft
$222/Sq Ft
Est. Value
About This Home
This home is located at 450 Winding Canyon Way, Algonquin, IL 60102 and is currently estimated at $404,227, approximately $221 per square foot. 450 Winding Canyon Way is a home located in Kane County with nearby schools including Algonquin Lakes Elementary School, Algonquin Middle School, and Dundee-Crown High School.
Ownership History
Date
Name
Owned For
Owner Type
Purchase Details
Closed on
Jun 28, 2005
Sold by
Cowen Matthew J and Johnson Misty S
Bought by
Delrio Gerardo and Del Rio Elizabeth
Current Estimated Value
Home Financials for this Owner
Home Financials are based on the most recent Mortgage that was taken out on this home.
Original Mortgage
$232,800
Outstanding Balance
$121,760
Interest Rate
5.69%
Mortgage Type
Fannie Mae Freddie Mac
Estimated Equity
$282,467
Purchase Details
Closed on
Oct 8, 2001
Sold by
Realen Homes Lp
Bought by
Cowen Matthew J and Johnson Misty S
Home Financials for this Owner
Home Financials are based on the most recent Mortgage that was taken out on this home.
Original Mortgage
$233,400
Interest Rate
6.92%
Create a Home Valuation Report for This Property
The Home Valuation Report is an in-depth analysis detailing your home's value as well as a comparison with similar homes in the area
Home Values in the Area
Average Home Value in this Area
Purchase History
| Date | Buyer | Sale Price | Title Company |
|---|---|---|---|
| Delrio Gerardo | $291,000 | Republic Title | |
| Cowen Matthew J | $246,000 | Chicago Title Insurance Co |
Source: Public Records
Mortgage History
| Date | Status | Borrower | Loan Amount |
|---|---|---|---|
| Open | Delrio Gerardo | $232,800 | |
| Previous Owner | Cowen Matthew J | $233,400 |
Source: Public Records
Tax History Compared to Growth
Tax History
| Year | Tax Paid | Tax Assessment Tax Assessment Total Assessment is a certain percentage of the fair market value that is determined by local assessors to be the total taxable value of land and additions on the property. | Land | Improvement |
|---|---|---|---|---|
| 2024 | $8,441 | $119,021 | $25,730 | $93,291 |
| 2023 | $8,065 | $107,091 | $23,151 | $83,940 |
| 2022 | $7,893 | $100,445 | $23,151 | $77,294 |
| 2021 | $7,661 | $94,840 | $21,859 | $72,981 |
| 2020 | $7,512 | $92,708 | $21,368 | $71,340 |
| 2019 | $7,282 | $88,009 | $20,285 | $67,724 |
| 2018 | $7,214 | $84,242 | $19,883 | $64,359 |
| 2017 | $6,922 | $78,805 | $18,600 | $60,205 |
| 2016 | $6,798 | $73,331 | $18,522 | $54,809 |
| 2015 | -- | $68,714 | $17,356 | $51,358 |
| 2014 | -- | $65,735 | $16,877 | $48,858 |
| 2013 | -- | $67,747 | $17,394 | $50,353 |
Source: Public Records
Map
Nearby Homes
- 400 Diamond Back Way
- 601 Lake Cornish Way
- 460 Mahogany Dr
- 9999 Sandbloom Rd
- 451 Mahogany Dr
- 2003 Magenta Ln
- 1114 Riverwood Dr Unit 1114
- 1535 Teri Ln
- 1551 Glacier Trail Unit 644
- 2150 E Algonquin Rd
- Lot 4 b Ryan Pkwy
- 1770 E Algonquin Rd
- 69 Alice St
- 1943 Ozark Pkwy
- 1715 Riverwood Dr
- 1782 Cumberland Pkwy
- 1659 E Algonquin Rd
- 2 Cumberland Pkwy
- 2260 Indigo Dr
- 713 Silverstone Dr Unit 77
- 460 Winding Canyon Way
- 440 Winding Canyon Way
- 441 Diamond Back Way
- 451 Diamond Back Way
- 470 Winding Canyon Way
- 430 Winding Canyon Way
- 431 Diamond Back Way
- 441 Winding Canyon Way
- 431 Winding Canyon Way
- 461 Diamond Back Way
- 451 Winding Canyon Way Unit 3A
- 480 Winding Canyon Way
- 420 Winding Canyon Way
- 421 Diamond Back Way Unit 4A
- 461 Winding Canyon Way Unit 1
- 421 Winding Canyon Way
- 1 Winding Canyon Ct
- 471 Diamond Back Way
- 471 Winding Canyon Way
- 490 Winding Canyon Way