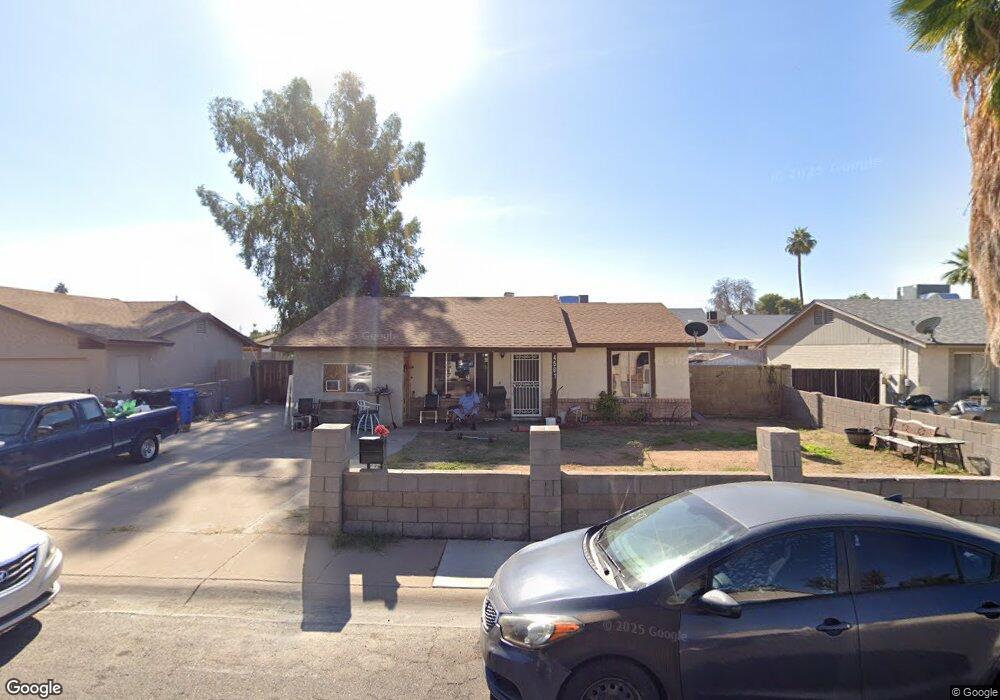
4501 E Wayland Rd Phoenix, AZ 85040
South Mountain NeighborhoodEstimated Value: $266,997 - $341,000
--
Bed
1
Bath
1,204
Sq Ft
$263/Sq Ft
Est. Value
About This Home
This home is located at 4501 E Wayland Rd, Phoenix, AZ 85040 and is currently estimated at $317,249, approximately $263 per square foot. 4501 E Wayland Rd is a home located in Maricopa County with nearby schools including Wood Elementary School, Geneva Epps Mosley Middle School, and Tempe High School.
Ownership History
Date
Name
Owned For
Owner Type
Purchase Details
Closed on
Jan 19, 2005
Sold by
Walker H Yvonne
Bought by
Crift Frances
Current Estimated Value
Home Financials for this Owner
Home Financials are based on the most recent Mortgage that was taken out on this home.
Original Mortgage
$58,710
Interest Rate
5.67%
Mortgage Type
Purchase Money Mortgage
Purchase Details
Closed on
Oct 24, 1996
Sold by
Walker H Yvonne
Bought by
Crift Francis
Purchase Details
Closed on
Jul 11, 1994
Sold by
Cisneros Henry G
Bought by
Walker H Yvonne
Home Financials for this Owner
Home Financials are based on the most recent Mortgage that was taken out on this home.
Original Mortgage
$31,900
Interest Rate
8.57%
Create a Home Valuation Report for This Property
The Home Valuation Report is an in-depth analysis detailing your home's value as well as a comparison with similar homes in the area
Home Values in the Area
Average Home Value in this Area
Purchase History
| Date | Buyer | Sale Price | Title Company |
|---|---|---|---|
| Crift Frances | -- | Stellar Title | |
| Crift Francis | -- | -- | |
| Walker H Yvonne | -- | Grand Canyon Title Agency In |
Source: Public Records
Mortgage History
| Date | Status | Borrower | Loan Amount |
|---|---|---|---|
| Closed | Crift Frances | $58,710 | |
| Previous Owner | Walker H Yvonne | $31,900 |
Source: Public Records
Tax History
| Year | Tax Paid | Tax Assessment Tax Assessment Total Assessment is a certain percentage of the fair market value that is determined by local assessors to be the total taxable value of land and additions on the property. | Land | Improvement |
|---|---|---|---|---|
| 2025 | $554 | $5,513 | -- | -- |
| 2024 | $512 | $5,250 | -- | -- |
| 2023 | $512 | $21,250 | $4,250 | $17,000 |
| 2022 | $491 | $16,220 | $3,240 | $12,980 |
| 2021 | $502 | $14,460 | $2,890 | $11,570 |
| 2020 | $485 | $12,280 | $2,450 | $9,830 |
| 2019 | $476 | $10,670 | $2,130 | $8,540 |
| 2018 | $463 | $10,080 | $2,010 | $8,070 |
| 2017 | $447 | $8,060 | $1,610 | $6,450 |
| 2016 | $444 | $6,860 | $1,370 | $5,490 |
| 2015 | $418 | $5,280 | $1,050 | $4,230 |
Source: Public Records
Map
Nearby Homes
- 4456 E Hidalgo Ave
- 5421 S 44th Place
- 4620 E Southern Ave
- 4407 E Lynne Ln
- 4415 E Chambers St
- 5613 S 42nd St
- 4175 E Pecan Rd
- 5814 S Daisy Patch Place
- 6437 S 43rd Place
- 4117 E La Salle St
- 4034 E Chambers St
- 2609 W Southern Ave Unit 109
- 2609 W Southern Ave Unit 379
- 2609 W Southern Ave Unit 108
- 2609 W Southern Ave Unit 398
- 2609 W Southern Ave Unit 169
- 2609 W Southern Ave Unit 406
- 2609 W Southern Ave Unit 125
- 2609 W Southern Ave Unit 60
- 4325 E Vineyard Rd
- 4507 E Wayland Rd Unit 5
- 4449 E Wayland Rd
- 4450 E Hidalgo Ave
- 4513 E Wayland Rd
- 4443 E Wayland Rd
- 5801 S 45th St
- 4502 E Wayland Rd
- 4450 E Wayland Rd
- 4444 E Hidalgo Ave
- 4508 E Wayland Rd
- 4444 E Wayland Rd
- 4437 E Wayland Rd
- 4519 E Wayland Rd
- 5652 S 45th Place
- 5807 S 45th St
- 4438 E Hidalgo Ave
- 4514 E Wayland Rd
- 4438 E Wayland Rd Unit 5
- 4525 E Pecan Rd
- 4519 E Pecan Rd
Your Personal Tour Guide
Ask me questions while you tour the home.