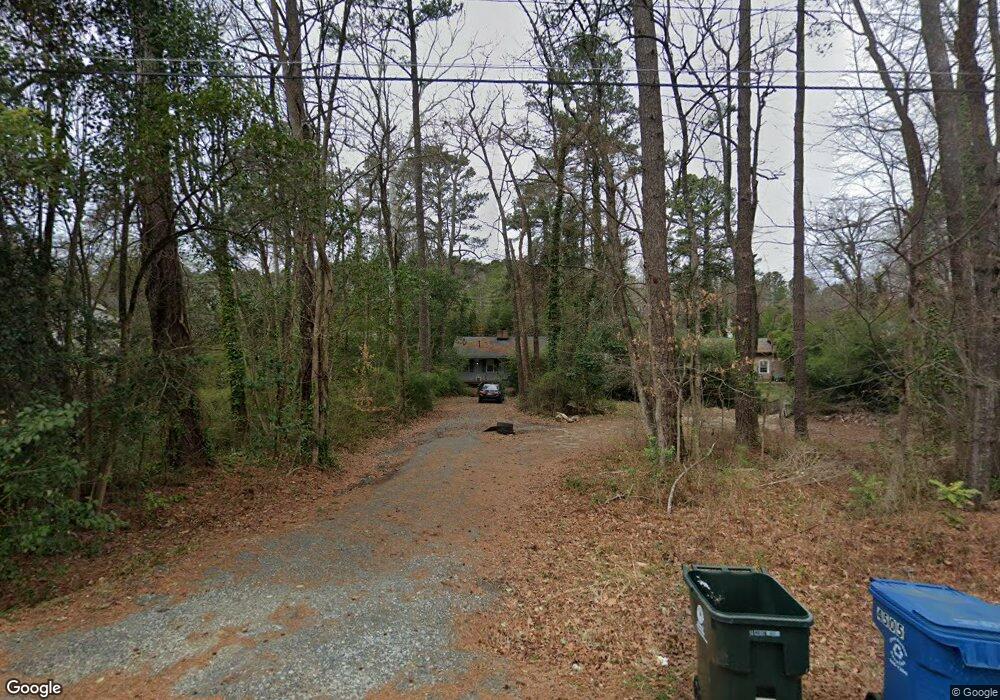
4501 Ryan St Durham, NC 27704
Weaver NeighborhoodEstimated Value: $156,000 - $252,000
2
Beds
2
Baths
864
Sq Ft
$236/Sq Ft
Est. Value
About This Home
This home is located at 4501 Ryan St, Durham, NC 27704 and is currently estimated at $203,773, approximately $235 per square foot. 4501 Ryan St is a home located in Durham County with nearby schools including Eno Valley Elementary, George L Carrington Middle, and Northern High School.
Ownership History
Date
Name
Owned For
Owner Type
Purchase Details
Closed on
May 18, 1998
Sold by
Holland Virginia M and Holland Frank H
Bought by
Excelnamics Inc
Current Estimated Value
Create a Home Valuation Report for This Property
The Home Valuation Report is an in-depth analysis detailing your home's value as well as a comparison with similar homes in the area
Home Values in the Area
Average Home Value in this Area
Purchase History
| Date | Buyer | Sale Price | Title Company |
|---|---|---|---|
| Excelnamics Inc | -- | -- |
Source: Public Records
Tax History
| Year | Tax Paid | Tax Assessment Tax Assessment Total Assessment is a certain percentage of the fair market value that is determined by local assessors to be the total taxable value of land and additions on the property. | Land | Improvement |
|---|---|---|---|---|
| 2025 | $1,509 | $152,272 | $73,025 | $79,247 |
| 2024 | $1,719 | $123,248 | $15,887 | $107,361 |
| 2023 | $1,614 | $123,248 | $15,887 | $107,361 |
| 2022 | $1,577 | $123,248 | $15,887 | $107,361 |
| 2021 | $1,570 | $123,248 | $15,887 | $107,361 |
| 2020 | $1,533 | $123,248 | $15,887 | $107,361 |
| 2019 | $1,533 | $123,248 | $15,887 | $107,361 |
| 2018 | $1,353 | $99,731 | $22,312 | $77,419 |
| 2017 | $1,343 | $99,731 | $22,312 | $77,419 |
| 2016 | $1,298 | $99,731 | $22,312 | $77,419 |
| 2015 | $1,171 | $84,625 | $21,983 | $62,642 |
| 2014 | $1,171 | $84,625 | $21,983 | $62,642 |
Source: Public Records
Map
Nearby Homes
- 4429 Ryan St
- 4505 Laymans Chapel Rd
- 4511 Denfield St
- 320 Todd St
- 121 Argonne Dr
- 35 Stonewall Way
- 12 Patriot Cir
- 844 Horton Rd Unit 56
- 4123 Casa St
- 11 Sweetbay Ct
- 312 Teel Dr
- 213 Teel Dr
- 2123 Titanium Rock Rd
- 606 Valley Dr
- 2125 Titanium Rock Rd
- 2129 Titanium Rock Rd
- 2200 Titanium Rock Rd
- 812 Chalk Level Rd
- 906 Calumet Dr
- 108 Parsons Green Ct
Your Personal Tour Guide
Ask me questions while you tour the home.