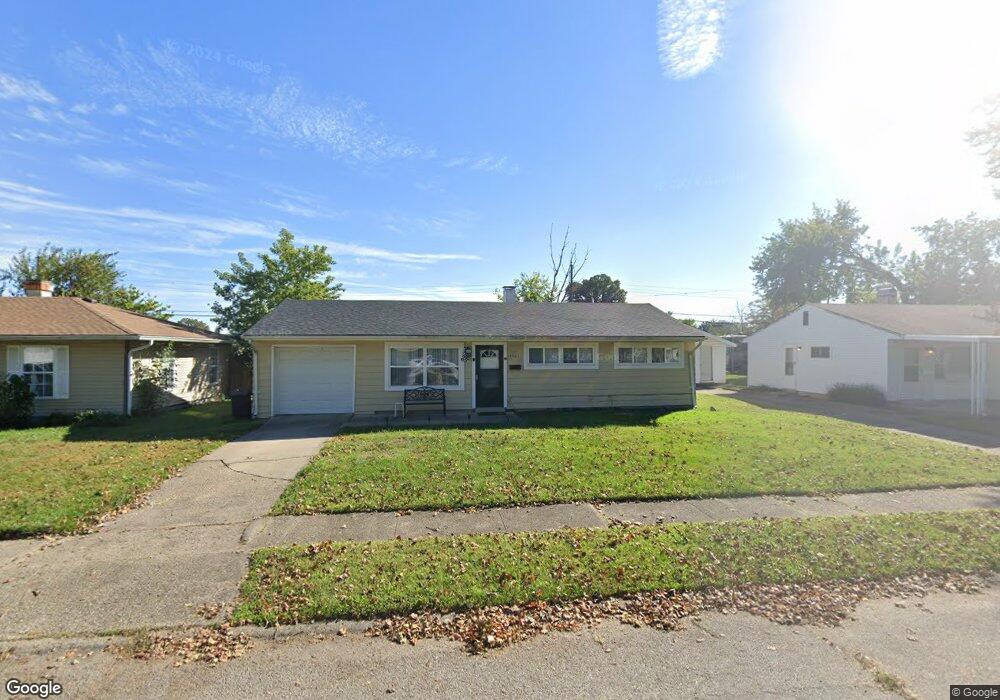
4501 W 28th St Indianapolis, IN 46222
Estimated Value: $117,000 - $159,267
3
Beds
2
Baths
936
Sq Ft
$158/Sq Ft
Est. Value
About This Home
This home is located at 4501 W 28th St, Indianapolis, IN 46222 and is currently estimated at $148,067, approximately $158 per square foot. 4501 W 28th St is a home located in Marion County with nearby schools including Carl Wilde School 79, Lew Wallace School 107, and Meredith Nicholson School 96.
Ownership History
Date
Name
Owned For
Owner Type
Purchase Details
Closed on
Dec 22, 2014
Sold by
Ader Jeffrey
Bought by
Chayil Capital Solutions Llc
Current Estimated Value
Home Financials for this Owner
Home Financials are based on the most recent Mortgage that was taken out on this home.
Original Mortgage
$75,200
Interest Rate
3.95%
Mortgage Type
Purchase Money Mortgage
Purchase Details
Closed on
Jun 12, 2014
Sold by
Law Robbie
Bought by
Ader Jeffrey
Purchase Details
Closed on
Aug 19, 2011
Sold by
The Mennonite Foundation Inc
Bought by
Rl Properties Llc
Purchase Details
Closed on
Jul 7, 2011
Sold by
Boschmann Erwin
Bought by
The Mennonite Foundation Inc
Purchase Details
Closed on
Mar 31, 2009
Sold by
Secretary Of Veterans Affairs
Bought by
Boschmann Erwin
Create a Home Valuation Report for This Property
The Home Valuation Report is an in-depth analysis detailing your home's value as well as a comparison with similar homes in the area
Home Values in the Area
Average Home Value in this Area
Purchase History
| Date | Buyer | Sale Price | Title Company |
|---|---|---|---|
| Chayil Capital Solutions Llc | -- | None Available | |
| Ader Jeffrey | $47,000 | Palladium Title Services Llc | |
| Ader Jeffrey | -- | None Available | |
| Rl Properties Llc | -- | Integrity Title Services | |
| The Mennonite Foundation Inc | -- | Integrity Title Services | |
| Boschmann Erwin | -- | None Available |
Source: Public Records
Mortgage History
| Date | Status | Borrower | Loan Amount |
|---|---|---|---|
| Previous Owner | Chayil Capital Solutions Llc | $75,200 |
Source: Public Records
Tax History Compared to Growth
Tax History
| Year | Tax Paid | Tax Assessment Tax Assessment Total Assessment is a certain percentage of the fair market value that is determined by local assessors to be the total taxable value of land and additions on the property. | Land | Improvement |
|---|---|---|---|---|
| 2024 | $2,640 | $105,300 | $7,000 | $98,300 |
| 2023 | $2,640 | $107,600 | $7,000 | $100,600 |
| 2022 | $2,438 | $99,600 | $7,000 | $92,600 |
| 2021 | $1,754 | $72,400 | $7,000 | $65,400 |
| 2020 | $1,474 | $60,100 | $7,000 | $53,100 |
| 2019 | $1,327 | $52,800 | $7,000 | $45,800 |
| 2018 | $1,337 | $52,800 | $7,000 | $45,800 |
| 2017 | $1,126 | $49,400 | $7,000 | $42,400 |
| 2016 | $1,102 | $49,400 | $7,000 | $42,400 |
| 2014 | $1,111 | $51,400 | $7,000 | $44,400 |
| 2013 | $1,283 | $53,800 | $7,000 | $46,800 |
Source: Public Records
Map
Nearby Homes
- 4513 Patricia St
- 4317 Patricia St
- 2640 Shirley Dr
- 4108 Kalmar Dr
- 3148 Keswick Rd
- 11 Digby Ct
- 3119 N Fuller Dr
- 2432 Allison Ave
- 4953 Mccray St
- 4908 Baxter Dr
- 4915 Baxter Dr
- 2203 Cord St
- 4113 Deborah St
- 4917 W 34th St
- 3152 Allison Ave
- 3440 Brewer Dr
- 3433 Welch Dr
- 3302 Allison Ave
- 4718 W 36th St
- 2005 Fisher Ave