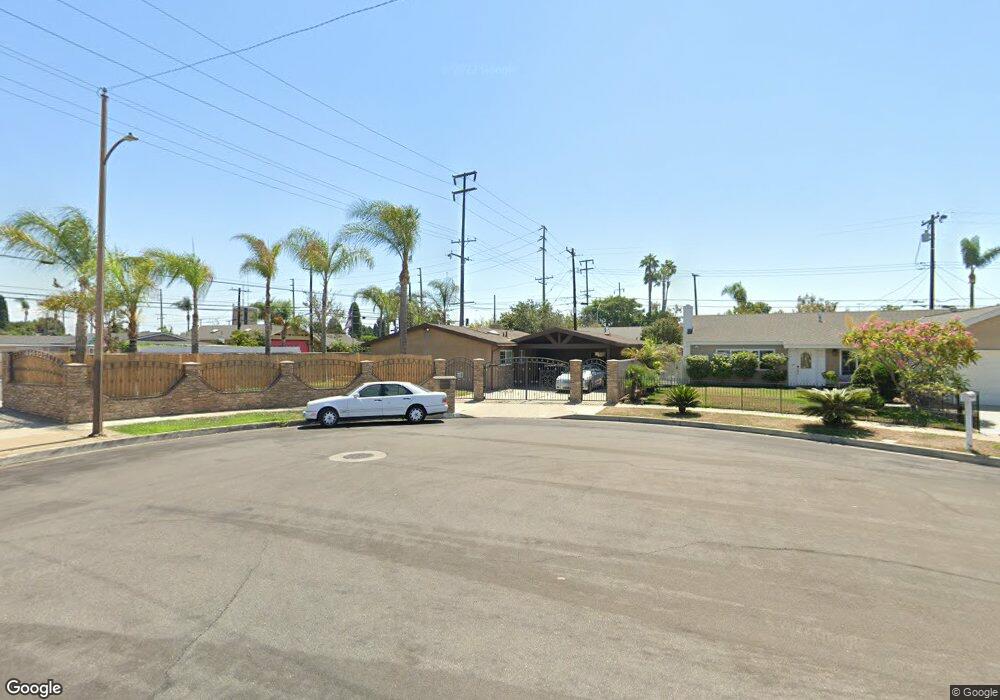
4502 Silver Dr Santa Ana, CA 92703
Riverview West NeighborhoodEstimated Value: $847,000 - $979,000
3
Beds
2
Baths
1,660
Sq Ft
$557/Sq Ft
Est. Value
About This Home
This home is located at 4502 Silver Dr, Santa Ana, CA 92703 and is currently estimated at $924,675, approximately $557 per square foot. 4502 Silver Dr is a home located in Orange County with nearby schools including Rosita Elementary School, James Irvine Intermediate School, and Los Amigos High School.
Ownership History
Date
Name
Owned For
Owner Type
Purchase Details
Closed on
Feb 24, 2004
Sold by
Arreola Brian Ramirez and Arreola Bryant
Bought by
Arreola Ulysses and Arreola Alma Delia
Current Estimated Value
Home Financials for this Owner
Home Financials are based on the most recent Mortgage that was taken out on this home.
Original Mortgage
$255,000
Outstanding Balance
$118,758
Interest Rate
5.62%
Mortgage Type
New Conventional
Estimated Equity
$805,917
Purchase Details
Closed on
Sep 2, 2003
Sold by
Arreola Ulysses and Arreola Fernando
Bought by
Arreola Ulysses and Arreola Alma Delia
Purchase Details
Closed on
Oct 25, 1996
Sold by
Ramirez Maria C and Ramirez Maria Concepcion
Bought by
Arreola Ulysses and Larios Andrea
Purchase Details
Closed on
Apr 9, 1996
Sold by
Arreola Ulysses and Ramirez Fernando Arreola
Bought by
Arreola Ulysses and Arreola Fernando
Create a Home Valuation Report for This Property
The Home Valuation Report is an in-depth analysis detailing your home's value as well as a comparison with similar homes in the area
Home Values in the Area
Average Home Value in this Area
Purchase History
| Date | Buyer | Sale Price | Title Company |
|---|---|---|---|
| Arreola Ulysses | -- | Commerce Title | |
| Arreola Ulysses | -- | -- | |
| Arreola Ulysses | -- | -- | |
| Arreola Ulysses | -- | -- |
Source: Public Records
Mortgage History
| Date | Status | Borrower | Loan Amount |
|---|---|---|---|
| Open | Arreola Ulysses | $255,000 |
Source: Public Records
Tax History Compared to Growth
Tax History
| Year | Tax Paid | Tax Assessment Tax Assessment Total Assessment is a certain percentage of the fair market value that is determined by local assessors to be the total taxable value of land and additions on the property. | Land | Improvement |
|---|---|---|---|---|
| 2025 | $4,704 | $395,263 | $322,575 | $72,688 |
| 2024 | $4,704 | $387,513 | $316,250 | $71,263 |
| 2023 | $4,617 | $379,915 | $310,049 | $69,866 |
| 2022 | $4,513 | $372,466 | $303,969 | $68,497 |
| 2021 | $4,452 | $365,163 | $298,009 | $67,154 |
| 2020 | $4,398 | $361,419 | $294,953 | $66,466 |
| 2019 | $4,341 | $354,333 | $289,170 | $65,163 |
| 2018 | $4,234 | $347,386 | $283,500 | $63,886 |
| 2017 | $4,192 | $340,575 | $277,941 | $62,634 |
| 2016 | $4,009 | $333,898 | $272,492 | $61,406 |
| 2015 | $3,957 | $328,883 | $268,399 | $60,484 |
| 2014 | $3,864 | $322,441 | $263,141 | $59,300 |
Source: Public Records
Map
Nearby Homes
- 4248 W 5th St
- 4201 W 5th St Unit 314
- 4518 W 1st St
- 4832 W 5th St Unit B
- 3932 W 5th St Unit 202
- 3929 W 5th St Unit 16
- 323 N Euclid St Unit 99
- 1114 N Gates St
- 5114 W 1st St Unit C
- 5112 W 1st St Unit C
- 5132 W 1st St Unit B
- 14376 Euclid St Unit 1-4
- 432 S Harbor Blvd Unit 101
- 432 S Harbor Blvd Unit 64
- 432 S Harbor Blvd Unit 7
- 5317 Silver Dr
- 526 W Tribella Ct
- 13322 Euclid St
- 4117 W Mcfadden Ave
- 4117 W Mcfadden Ave Unit 623
- 4506 Silver Dr
- 4507 W 5th St
- 4512 Silver Dr
- 4422 Silver Dr
- 4501 Silver Dr
- 4511 W 5th St
- 4507 Silver Dr
- 4516 Silver Dr
- 4418 Silver Dr
- 4511 Silver Dr
- 4517 W 5th St
- 4421 Silver Dr
- 4508 W 5th St Unit 51C
- 4518 W 5th St Unit 56
- 4516 W 5th St Unit 55
- 4520 W 5th St Unit 57
- 4514 W 5th St Unit 54
- 4522 W 5th St Unit 58
- 4506 W 5th St Unit 48
- 4506 W 5th St