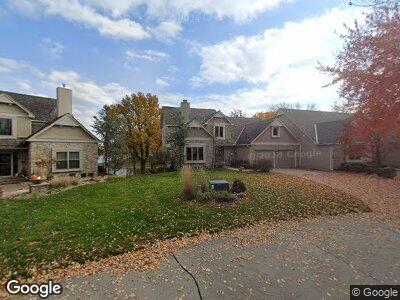
4503 NE Waters Edge St Lees Summit, MO 64064
Chapel Ridge NeighborhoodEstimated Value: $504,114 - $645,000
2
Beds
4
Baths
1,876
Sq Ft
$307/Sq Ft
Est. Value
About This Home
This home is located at 4503 NE Waters Edge St, Lees Summit, MO 64064 and is currently estimated at $576,279, approximately $307 per square foot. 4503 NE Waters Edge St is a home located in Jackson County with nearby schools including Chapel Lakes Elementary School, Delta Woods Middle School, and Blue Springs South High School.
Ownership History
Date
Name
Owned For
Owner Type
Purchase Details
Closed on
May 12, 2009
Sold by
Hoskins Julia A
Bought by
Cil Akin and Cil Ayca
Current Estimated Value
Home Financials for this Owner
Home Financials are based on the most recent Mortgage that was taken out on this home.
Original Mortgage
$265,050
Interest Rate
4.77%
Mortgage Type
Purchase Money Mortgage
Purchase Details
Closed on
Oct 13, 2005
Sold by
Hounchell Jerry D and Hounchell Hope E
Bought by
Hoskins Julia A
Purchase Details
Closed on
Jun 28, 1996
Sold by
Chalmers Jack C
Bought by
Hounchell Jerry D and Hounchell Hope E
Home Financials for this Owner
Home Financials are based on the most recent Mortgage that was taken out on this home.
Original Mortgage
$187,400
Interest Rate
5.75%
Mortgage Type
Purchase Money Mortgage
Create a Home Valuation Report for This Property
The Home Valuation Report is an in-depth analysis detailing your home's value as well as a comparison with similar homes in the area
Home Values in the Area
Average Home Value in this Area
Purchase History
| Date | Buyer | Sale Price | Title Company |
|---|---|---|---|
| Cil Akin | -- | Kansas City Title | |
| Hoskins Julia A | -- | First American Title Ins Co | |
| Hounchell Jerry D | -- | Security Land Title Company |
Source: Public Records
Mortgage History
| Date | Status | Borrower | Loan Amount |
|---|---|---|---|
| Open | Cil Ayca Aktas | $130,000 | |
| Closed | Cil Akin | $100,000 | |
| Closed | Cil Ayca Aktas | $228,000 | |
| Closed | Cil Akin | $265,050 | |
| Previous Owner | Hoskins Julia A | $252,000 | |
| Previous Owner | Hounchell Jerry D | $187,400 |
Source: Public Records
Tax History Compared to Growth
Tax History
| Year | Tax Paid | Tax Assessment Tax Assessment Total Assessment is a certain percentage of the fair market value that is determined by local assessors to be the total taxable value of land and additions on the property. | Land | Improvement |
|---|---|---|---|---|
| 2024 | $6,512 | $86,585 | $6,194 | $80,391 |
| 2023 | $6,512 | $86,585 | $8,326 | $78,259 |
| 2022 | $5,276 | $62,130 | $4,380 | $57,750 |
| 2021 | $5,271 | $62,130 | $4,380 | $57,750 |
| 2020 | $4,682 | $54,572 | $4,380 | $50,192 |
| 2019 | $4,538 | $54,572 | $4,380 | $50,192 |
| 2018 | $4,557 | $53,164 | $5,183 | $47,981 |
| 2017 | $4,429 | $53,164 | $5,183 | $47,981 |
| 2016 | $4,429 | $51,832 | $7,638 | $44,194 |
| 2014 | $4,258 | $49,522 | $7,144 | $42,378 |
Source: Public Records
Map
Nearby Homes
- 212 NE Landings Cir
- 4900 NE Maybrook Rd
- 234 NE Bayview Dr
- 604 NE Silverleaf Place
- 4134 NE Hampstead Dr
- 416 NE Brockton Dr
- 4121 NE Courtney Dr
- 712 NE Plumbrook Place
- 264 NE Edgewater Dr
- 4011 NE Woodridge Dr
- 4641 NE Fairway Homes Dr
- 4017 NE Woodridge Dr
- 4616 NW Bramble Trail
- 129 NE Edgewater Dr
- 4232 NE Tremont Ct
- 5103 NE Ash Grove Place
- 4004 NE Independence Ave
- 129 NE Wood Glen Ln
- 302 NW Bramble Trail Cir
- 525 NE Olympic Ct
- 4503 NE Waters Edge St
- 4501 NE Waters Edge St
- 4507 NE Waters Edge St
- 4509 NE Waters Edge St
- 4551 NE Waters Edge St
- 4549 NE Waters Edge St
- 4513 NE Waters Edge St
- 4605 NE Dick Howser Cir
- 4515 NE Waters Edge St
- 300 NE Dartmore Ct
- 4545 NE Waters Edge St
- 4607 NE Dick Howser Cir
- 304 NE Dartmore Ct
- 4603 NE Dick Howser Cir
- 308 NE Dartmore Ct
- 4519 NE Waters Edge St
- 4601 NE Dick Howser Cir
- 312 NE Dartmore Ct
- 4611 NE Dick Howser Cir
- 4609 NE Dick Howser Cir