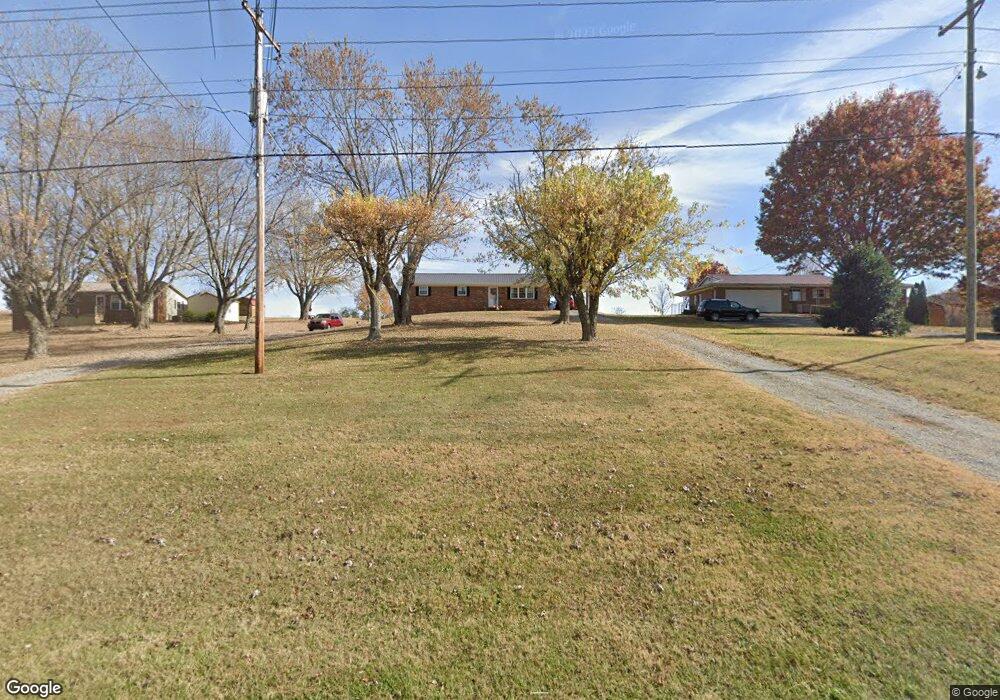
4505 Asheville Hwy Greeneville, TN 37743
Estimated Value: $234,460 - $294,000
--
Bed
2
Baths
1,296
Sq Ft
$203/Sq Ft
Est. Value
About This Home
This home is located at 4505 Asheville Hwy, Greeneville, TN 37743 and is currently estimated at $262,865, approximately $202 per square foot. 4505 Asheville Hwy is a home located in Greene County with nearby schools including Camp Creek Elementary School, South Greene Middle School, and South Greene High School.
Ownership History
Date
Name
Owned For
Owner Type
Purchase Details
Closed on
Jul 31, 2020
Sold by
Lanbo Home Solutions Inc
Bought by
Mitchell Marshall G and Mitchell Betty J
Current Estimated Value
Home Financials for this Owner
Home Financials are based on the most recent Mortgage that was taken out on this home.
Original Mortgage
$150,100
Outstanding Balance
$133,395
Interest Rate
3.1%
Mortgage Type
New Conventional
Estimated Equity
$129,470
Purchase Details
Closed on
Jan 15, 2020
Sold by
Davis Charles Robert and Davis Shelby
Bought by
Lanbo Home Solutions Inc
Home Financials for this Owner
Home Financials are based on the most recent Mortgage that was taken out on this home.
Original Mortgage
$70,000
Interest Rate
3.6%
Mortgage Type
Seller Take Back
Purchase Details
Closed on
Nov 10, 1997
Sold by
Holt Mike L and Holt Connie
Bought by
Davis Charles
Purchase Details
Closed on
Mar 24, 1993
Bought by
Holt Neas Connie Mike L
Create a Home Valuation Report for This Property
The Home Valuation Report is an in-depth analysis detailing your home's value as well as a comparison with similar homes in the area
Home Values in the Area
Average Home Value in this Area
Purchase History
| Date | Buyer | Sale Price | Title Company |
|---|---|---|---|
| Mitchell Marshall G | $158,000 | Unified Title & Escrow Inc | |
| Lanbo Home Solutions Inc | $90,000 | None Available | |
| Davis Charles | $82,500 | -- | |
| Holt Neas Connie Mike L | $50,000 | -- |
Source: Public Records
Mortgage History
| Date | Status | Borrower | Loan Amount |
|---|---|---|---|
| Open | Mitchell Marshall G | $150,100 | |
| Previous Owner | Lanbo Home Solutions Inc | $70,000 |
Source: Public Records
Tax History Compared to Growth
Tax History
| Year | Tax Paid | Tax Assessment Tax Assessment Total Assessment is a certain percentage of the fair market value that is determined by local assessors to be the total taxable value of land and additions on the property. | Land | Improvement |
|---|---|---|---|---|
| 2024 | $886 | $53,675 | $5,100 | $48,575 |
| 2023 | $886 | $53,675 | $0 | $0 |
| 2022 | $570 | $28,300 | $4,250 | $24,050 |
| 2021 | $570 | $28,300 | $4,250 | $24,050 |
| 2020 | $570 | $28,300 | $4,250 | $24,050 |
| 2019 | $570 | $28,300 | $4,250 | $24,050 |
| 2018 | $570 | $28,300 | $4,250 | $24,050 |
| 2017 | $545 | $27,625 | $4,250 | $23,375 |
| 2016 | $517 | $27,625 | $4,250 | $23,375 |
| 2015 | $517 | $27,625 | $4,250 | $23,375 |
| 2014 | $517 | $27,625 | $4,250 | $23,375 |
Source: Public Records
Map
Nearby Homes
- 80 Emperor Ln
- 280 Green Lawn Ave
- tbd Par Ln Unit Lot 4
- 40 Oakmont Ln
- 175 Golf Trace Dr
- 260 Par Ln
- 00 W Allens Bridge Rd
- 3822 Asheville Hwy
- 35 Alpine Cove
- 960 E Allens Bridge Rd
- 294 River Pointe Dr
- 48 River Pointe Dr
- 1 River Pointe Dr
- 71 River Pointe Dr
- 72 River Pointe Dr
- 61 River Pointe Dr
- 96 River Pointe Dr
- 7 River Pointe Dr
- 62 River Pointe Dr
- Lot 58 River Pointe Dr
- 4525 Asheville Hwy
- 4473 Asheville Hwy
- 4500 Asheville Hwy
- 4555 Asheville Hwy
- 4522 Asheville Hwy
- 4510 Asheville Hwy
- 4460 Asheville Hwy
- 4482 Asheville Hwy
- 4581 Asheville Hwy
- 4444 Asheville Hwy
- 4422 Asheville Hwy
- 4410 Asheville Hwy
- 4400 Asheville Hwy
- 210 Emperor Ln
- 190 Emperor Ln
- 4532 Asheville Hwy
- 4532 Asheville Hwy
- 4534 Asheville Hwy
- 4339 Asheville Hwy
- 4695 Asheville Hwy