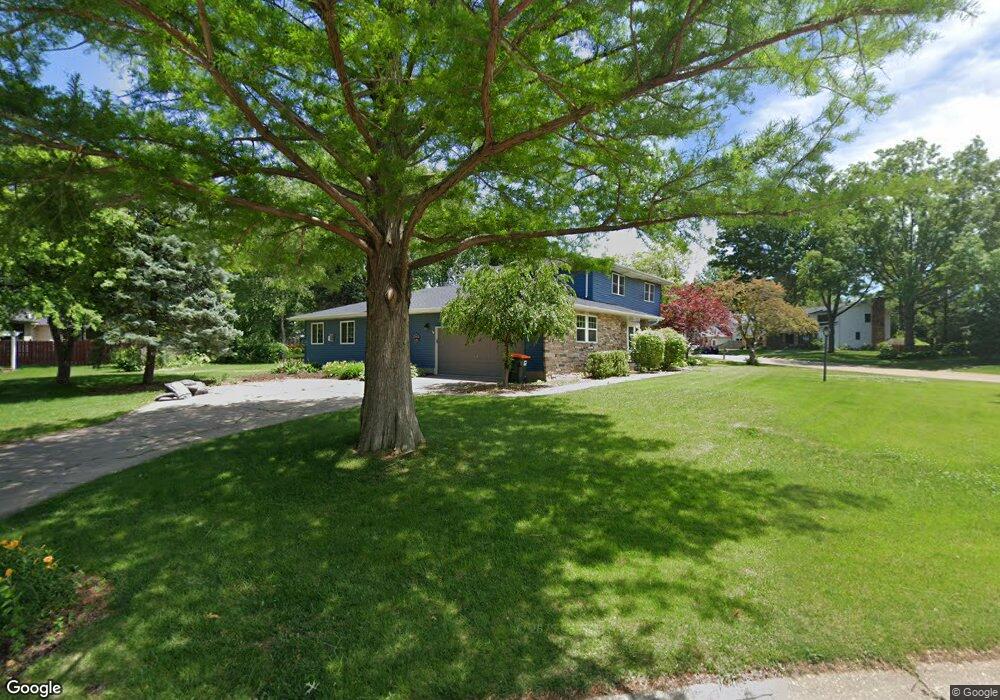
4505 Spring St Davenport, IA 52807
North Side NeighborhoodEstimated Value: $367,100 - $395,000
3
Beds
3
Baths
3,172
Sq Ft
$120/Sq Ft
Est. Value
About This Home
This home is located at 4505 Spring St, Davenport, IA 52807 and is currently estimated at $379,525, approximately $119 per square foot. 4505 Spring St is a home located in Scott County with nearby schools including Eisenhower Elementary School, Sudlow Intermediate School, and Central High School.
Ownership History
Date
Name
Owned For
Owner Type
Purchase Details
Closed on
Nov 4, 2020
Sold by
Krawiec Gregory S and Krawiec Susan
Bought by
Styvaert Benjamin W
Current Estimated Value
Home Financials for this Owner
Home Financials are based on the most recent Mortgage that was taken out on this home.
Original Mortgage
$247,500
Outstanding Balance
$219,737
Interest Rate
2.8%
Mortgage Type
New Conventional
Estimated Equity
$159,788
Purchase Details
Closed on
Apr 19, 2007
Sold by
Mills Jean and Cohen Martin G
Bought by
Krawiec Gregory S and Krawiec Susan
Home Financials for this Owner
Home Financials are based on the most recent Mortgage that was taken out on this home.
Original Mortgage
$162,400
Interest Rate
6.21%
Mortgage Type
New Conventional
Create a Home Valuation Report for This Property
The Home Valuation Report is an in-depth analysis detailing your home's value as well as a comparison with similar homes in the area
Home Values in the Area
Average Home Value in this Area
Purchase History
| Date | Buyer | Sale Price | Title Company |
|---|---|---|---|
| Styvaert Benjamin W | $275,000 | None Available | |
| Krawiec Gregory S | $203,000 | None Available |
Source: Public Records
Mortgage History
| Date | Status | Borrower | Loan Amount |
|---|---|---|---|
| Open | Styvaert Benjamin W | $247,500 | |
| Previous Owner | Krawiec Gregory S | $162,400 |
Source: Public Records
Tax History Compared to Growth
Tax History
| Year | Tax Paid | Tax Assessment Tax Assessment Total Assessment is a certain percentage of the fair market value that is determined by local assessors to be the total taxable value of land and additions on the property. | Land | Improvement |
|---|---|---|---|---|
| 2025 | $5,692 | $358,000 | $54,720 | $303,280 |
| 2024 | $5,552 | $328,770 | $54,720 | $274,050 |
| 2023 | $5,372 | $328,770 | $54,720 | $274,050 |
| 2022 | $5,722 | $260,410 | $48,960 | $211,450 |
| 2021 | $5,722 | $275,630 | $48,960 | $226,670 |
| 2020 | $5,394 | $257,130 | $48,960 | $208,170 |
| 2019 | $5,238 | $241,990 | $48,960 | $193,030 |
| 2018 | $985 | $241,990 | $48,960 | $193,030 |
| 2017 | $5,008 | $232,520 | $48,960 | $183,560 |
| 2016 | $4,818 | $228,750 | $0 | $0 |
| 2015 | $4,818 | $216,820 | $0 | $0 |
| 2014 | $4,622 | $216,820 | $0 | $0 |
| 2013 | $4,538 | $0 | $0 | $0 |
| 2012 | -- | $201,710 | $48,820 | $152,890 |
Source: Public Records
Map
Nearby Homes
- 4324 Spring St
- 2318 E 46th St
- 4600 Eastern Ave
- 2321 E 47th St
- 4230 Jersey Ridge Rd
- 1960 E 50th Ct
- 1704 Stone Gate Cir
- 2403 E 51st St Unit 102E
- 1814 E 38th Street Ct Unit 4B
- 2422 E 51st St Unit E
- 4005 Forest Rd
- 4919 Lorton Ave
- 2506 E 35th Street Ct
- 2919 E 44th Ct
- 1227 E Kimberly Rd Unit 5A
- 3324 Eastern Ave
- 2501 E 34th Street Ct
- 2916 E 45th Ct
- 3567 Kimberly Downs Rd
- 5810 Indigo Ave