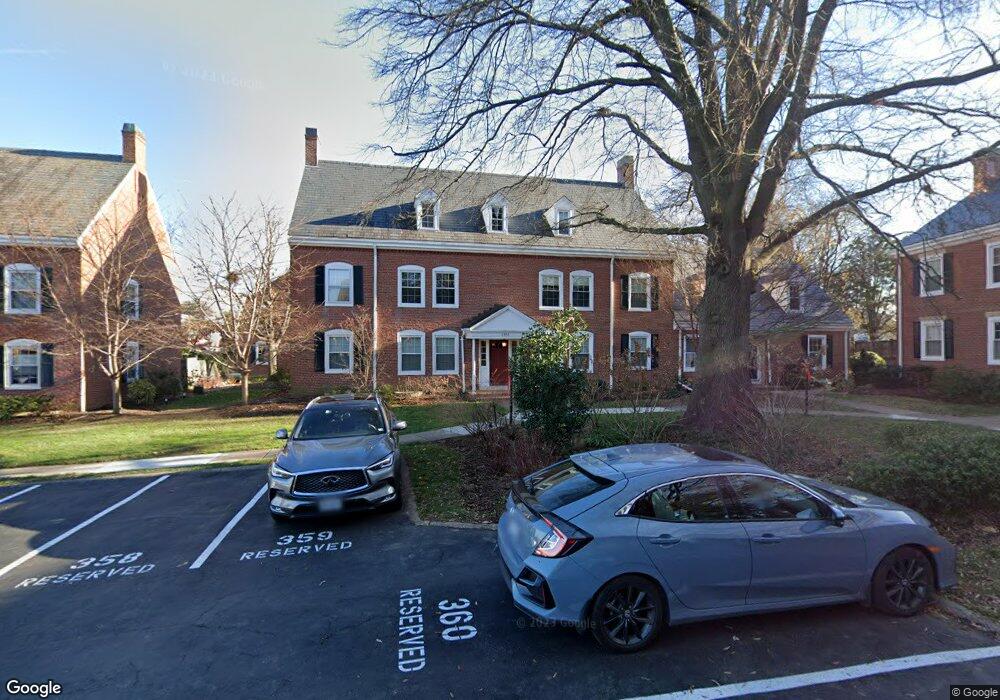
4506 36th St S Unit A1 Arlington, VA 22206
Fairlington NeighborhoodEstimated Value: $497,000 - $610,809
1
Bed
2
Baths
1,490
Sq Ft
$373/Sq Ft
Est. Value
About This Home
This home is located at 4506 36th St S Unit A1, Arlington, VA 22206 and is currently estimated at $555,452, approximately $372 per square foot. 4506 36th St S Unit A1 is a home located in Arlington County with nearby schools including Gunston Middle School, Wakefield High School, and Guidepost Montessori at West Alex.
Ownership History
Date
Name
Owned For
Owner Type
Purchase Details
Closed on
Jan 7, 2005
Sold by
Scally Patrick
Bought by
Pilco Eliseo
Current Estimated Value
Home Financials for this Owner
Home Financials are based on the most recent Mortgage that was taken out on this home.
Original Mortgage
$332,500
Outstanding Balance
$167,874
Interest Rate
5.75%
Mortgage Type
New Conventional
Estimated Equity
$387,578
Purchase Details
Closed on
Oct 22, 2004
Sold by
French Rebekah
Bought by
Straub Karl
Home Financials for this Owner
Home Financials are based on the most recent Mortgage that was taken out on this home.
Original Mortgage
$306,300
Interest Rate
5.85%
Mortgage Type
New Conventional
Purchase Details
Closed on
Aug 2, 1995
Sold by
Barcroft Ptns
Bought by
Scally Patrick W
Home Financials for this Owner
Home Financials are based on the most recent Mortgage that was taken out on this home.
Original Mortgage
$121,900
Interest Rate
7.48%
Create a Home Valuation Report for This Property
The Home Valuation Report is an in-depth analysis detailing your home's value as well as a comparison with similar homes in the area
Home Values in the Area
Average Home Value in this Area
Purchase History
| Date | Buyer | Sale Price | Title Company |
|---|---|---|---|
| Pilco Eliseo | $350,000 | -- | |
| Straub Karl | $406,300 | -- | |
| Scally Patrick W | $125,000 | -- |
Source: Public Records
Mortgage History
| Date | Status | Borrower | Loan Amount |
|---|---|---|---|
| Open | Pilco Eliseo | $332,500 | |
| Previous Owner | Straub Karl | $306,300 | |
| Previous Owner | Scally Patrick W | $121,900 |
Source: Public Records
Tax History Compared to Growth
Tax History
| Year | Tax Paid | Tax Assessment Tax Assessment Total Assessment is a certain percentage of the fair market value that is determined by local assessors to be the total taxable value of land and additions on the property. | Land | Improvement |
|---|---|---|---|---|
| 2025 | $5,623 | $544,300 | $43,200 | $501,100 |
| 2024 | $5,295 | $512,600 | $43,200 | $469,400 |
| 2023 | $5,057 | $491,000 | $43,200 | $447,800 |
| 2022 | $4,970 | $482,500 | $43,200 | $439,300 |
| 2021 | $4,762 | $462,300 | $39,200 | $423,100 |
| 2020 | $4,198 | $409,200 | $39,200 | $370,000 |
| 2019 | $3,895 | $379,600 | $35,800 | $343,800 |
| 2018 | $3,723 | $370,100 | $35,800 | $334,300 |
| 2017 | $3,630 | $360,800 | $35,800 | $325,000 |
| 2016 | $3,486 | $351,800 | $35,800 | $316,000 |
| 2015 | $3,504 | $351,800 | $35,800 | $316,000 |
| 2014 | $3,504 | $351,800 | $35,800 | $316,000 |
Source: Public Records
Map
Nearby Homes
- 3535 S Wakefield St
- 3622 S Taylor St
- 4118 36th St S Unit A1
- 3361 S Wakefield St Unit B1
- 4671 36th St S Unit A
- 4673 34th St S
- 4698 36th St S Unit A
- 1641 Kenwood Ave
- 4642 31st Rd S
- 2500 N Van Dorn St Unit 517
- 2500 N Van Dorn St Unit 1118
- 2500 N Van Dorn St Unit 316
- 2500 N Van Dorn St Unit 910
- 2500 N Van Dorn St Unit 817
- 2500 N Van Dorn St Unit 1119
- 2500 N Van Dorn St Unit 801
- 3249 Martha Custis Dr Unit 847
- 3343 Martha Custis Dr
- 3106 Ravensworth Place
- 1605 Crestwood Dr
- 4506 36th St S Unit B1
- 4506 36th St S Unit B2
- 4506 36th St S Unit A2
- 4508 36th St S
- 4510 36th St S
- 4454 36th St S
- 4454 36th St S Unit 1421
- 4504 36th St S Unit B2
- 4504 36th St S Unit A2
- 4504 36th St S Unit B1
- 4504 36th St S Unit A1
- 4504 36th St S Unit 1A
- 4452 36th St S
- 4512 36th St S Unit A1
- 4512 36th St S Unit B2
- 4512 36th St S Unit A2
- 4512 36th St S Unit B1
- 4458 36th St S
- 4450 36th St S
- 4448 36th St S