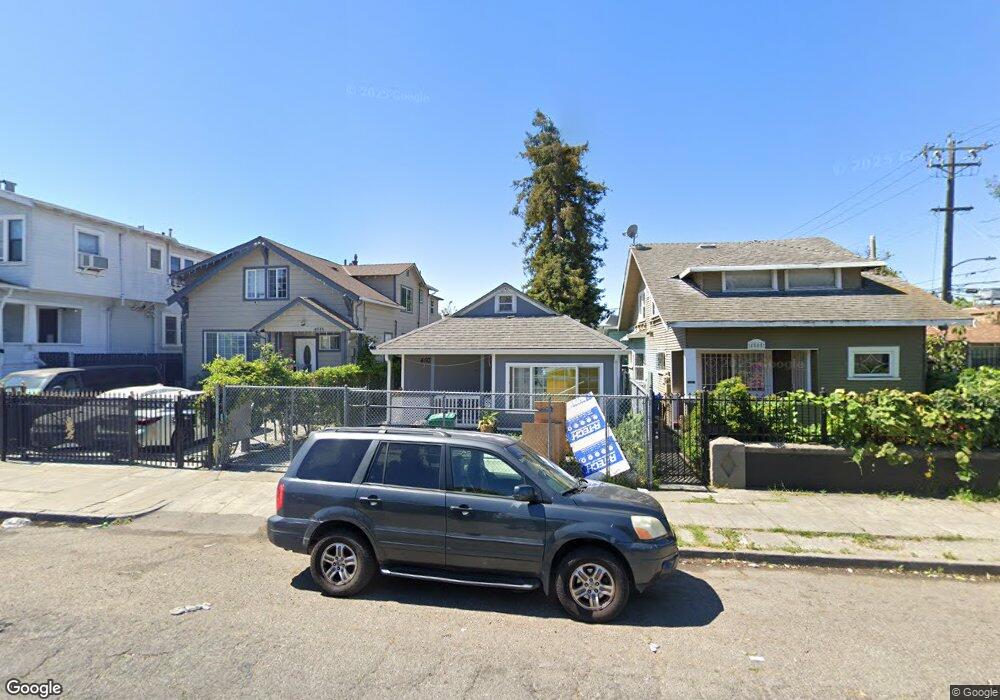
4507 Bond St Oakland, CA 94601
Fremont NeighborhoodEstimated Value: $335,605 - $539,000
2
Beds
1
Bath
809
Sq Ft
$575/Sq Ft
Est. Value
About This Home
This home is located at 4507 Bond St, Oakland, CA 94601 and is currently estimated at $465,151, approximately $574 per square foot. 4507 Bond St is a home located in Alameda County with nearby schools including Horace Mann Elementary School, Urban Promise Academy, and United For Success Academy.
Ownership History
Date
Name
Owned For
Owner Type
Purchase Details
Closed on
Dec 15, 2012
Sold by
Rodgers Janet M
Bought by
Rodgers Janet M and Davenport Constance L
Current Estimated Value
Home Financials for this Owner
Home Financials are based on the most recent Mortgage that was taken out on this home.
Original Mortgage
$118,200
Outstanding Balance
$81,893
Interest Rate
3.37%
Mortgage Type
New Conventional
Estimated Equity
$383,258
Purchase Details
Closed on
Jul 15, 2005
Sold by
Rodgers Bailey B
Bought by
Rodgers Janet M
Purchase Details
Closed on
Dec 10, 2004
Sold by
Rodgers Bailey B and Rodgers Janet
Bought by
Rodgers Bailey B
Purchase Details
Closed on
Apr 15, 1996
Sold by
Truckee River Bank
Bought by
Truckee River Bank
Create a Home Valuation Report for This Property
The Home Valuation Report is an in-depth analysis detailing your home's value as well as a comparison with similar homes in the area
Home Values in the Area
Average Home Value in this Area
Purchase History
| Date | Buyer | Sale Price | Title Company |
|---|---|---|---|
| Rodgers Janet M | -- | Placer Title Company | |
| Rodgers Janet M | -- | -- | |
| Rodgers Bailey B | -- | -- | |
| Truckee River Bank | $79,345 | North American Title Co |
Source: Public Records
Mortgage History
| Date | Status | Borrower | Loan Amount |
|---|---|---|---|
| Open | Rodgers Janet M | $118,200 |
Source: Public Records
Tax History
| Year | Tax Paid | Tax Assessment Tax Assessment Total Assessment is a certain percentage of the fair market value that is determined by local assessors to be the total taxable value of land and additions on the property. | Land | Improvement |
|---|---|---|---|---|
| 2025 | $2,226 | $20,704 | $16,426 | $11,278 |
| 2024 | $2,226 | $20,161 | $16,104 | $11,057 |
| 2023 | $2,067 | $26,629 | $15,789 | $10,840 |
| 2022 | $1,931 | $19,106 | $15,479 | $10,627 |
| 2021 | $1,672 | $18,595 | $15,176 | $10,419 |
| 2020 | $1,773 | $25,332 | $15,020 | $10,312 |
| 2019 | $1,477 | $24,836 | $14,726 | $10,110 |
| 2018 | $1,449 | $24,349 | $14,437 | $9,912 |
| 2017 | $1,352 | $23,871 | $14,154 | $9,717 |
| 2016 | $1,202 | $23,403 | $13,876 | $9,527 |
| 2015 | $1,189 | $23,052 | $13,668 | $9,384 |
| 2014 | $1,165 | $22,600 | $13,400 | $9,200 |
Source: Public Records
Map
Nearby Homes
Your Personal Tour Guide
Ask me questions while you tour the home.