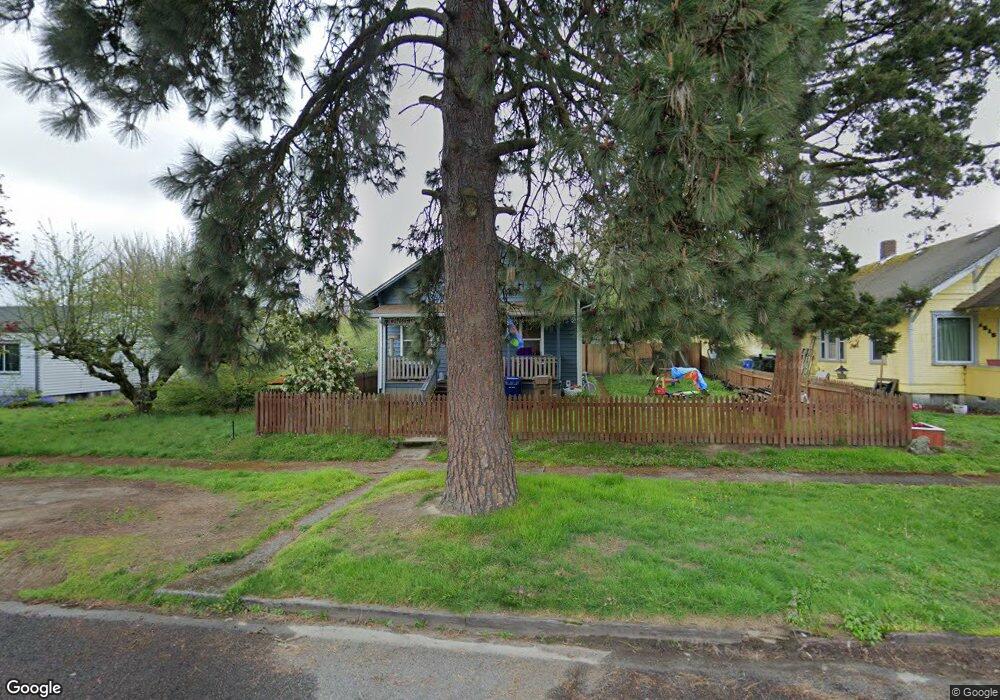
4509 E F St Tacoma, WA 98404
Eastside NeighborhoodEstimated Value: $346,000 - $412,000
2
Beds
1
Bath
912
Sq Ft
$427/Sq Ft
Est. Value
About This Home
This home is located at 4509 E F St, Tacoma, WA 98404 and is currently estimated at $389,450, approximately $427 per square foot. 4509 E F St is a home located in Pierce County with nearby schools including Lyon, Hunt Middle School, and Lincoln High School.
Ownership History
Date
Name
Owned For
Owner Type
Purchase Details
Closed on
Feb 28, 2007
Sold by
Hsbc Bank Usa Na
Bought by
Towerton Susan M
Current Estimated Value
Home Financials for this Owner
Home Financials are based on the most recent Mortgage that was taken out on this home.
Original Mortgage
$163,260
Outstanding Balance
$111,606
Interest Rate
8.77%
Mortgage Type
Balloon
Estimated Equity
$277,844
Purchase Details
Closed on
Nov 14, 2006
Sold by
Musgrove Corazon C
Bought by
Hsbc Bank Usa Na and Home Equity Loan Tr Series Ace 2006-He1
Purchase Details
Closed on
Oct 31, 2005
Sold by
Walston John C
Bought by
Musgrove Corazon C
Home Financials for this Owner
Home Financials are based on the most recent Mortgage that was taken out on this home.
Original Mortgage
$9,250
Interest Rate
5.74%
Mortgage Type
Stand Alone Second
Purchase Details
Closed on
Jan 30, 1995
Sold by
Libby Richard C
Bought by
Walston John C and Walston Lori L
Home Financials for this Owner
Home Financials are based on the most recent Mortgage that was taken out on this home.
Original Mortgage
$68,916
Interest Rate
9.2%
Mortgage Type
FHA
Create a Home Valuation Report for This Property
The Home Valuation Report is an in-depth analysis detailing your home's value as well as a comparison with similar homes in the area
Home Values in the Area
Average Home Value in this Area
Purchase History
| Date | Buyer | Sale Price | Title Company |
|---|---|---|---|
| Towerton Susan M | $181,400 | Fatco | |
| Hsbc Bank Usa Na | $185,023 | Fatco | |
| Musgrove Corazon C | $185,000 | Fidelity National Title Insu | |
| Walston John C | $69,000 | -- |
Source: Public Records
Mortgage History
| Date | Status | Borrower | Loan Amount |
|---|---|---|---|
| Open | Towerton Susan M | $163,260 | |
| Previous Owner | Musgrove Corazon C | $9,250 | |
| Previous Owner | Walston John C | $68,916 |
Source: Public Records
Tax History Compared to Growth
Tax History
| Year | Tax Paid | Tax Assessment Tax Assessment Total Assessment is a certain percentage of the fair market value that is determined by local assessors to be the total taxable value of land and additions on the property. | Land | Improvement |
|---|---|---|---|---|
| 2025 | $3,620 | $349,300 | $190,300 | $159,000 |
| 2024 | $3,620 | $354,000 | $183,100 | $170,900 |
| 2023 | $3,620 | $324,900 | $170,500 | $154,400 |
| 2022 | $3,310 | $340,500 | $170,800 | $169,700 |
| 2021 | $3,034 | $241,100 | $106,700 | $134,400 |
| 2019 | $2,517 | $216,300 | $89,000 | $127,300 |
| 2018 | $2,573 | $193,400 | $71,200 | $122,200 |
| 2017 | $2,215 | $162,700 | $55,000 | $107,700 |
| 2016 | $1,965 | $119,100 | $41,000 | $78,100 |
| 2014 | $1,747 | $112,900 | $39,700 | $73,200 |
| 2013 | $1,747 | $99,800 | $34,800 | $65,000 |
Source: Public Records
Map
Nearby Homes