451 Candlewood Ct Algonquin, IL 60102
High Hill Farms NeighborhoodEstimated Value: $313,373 - $377,000
3
Beds
2
Baths
966
Sq Ft
$358/Sq Ft
Est. Value
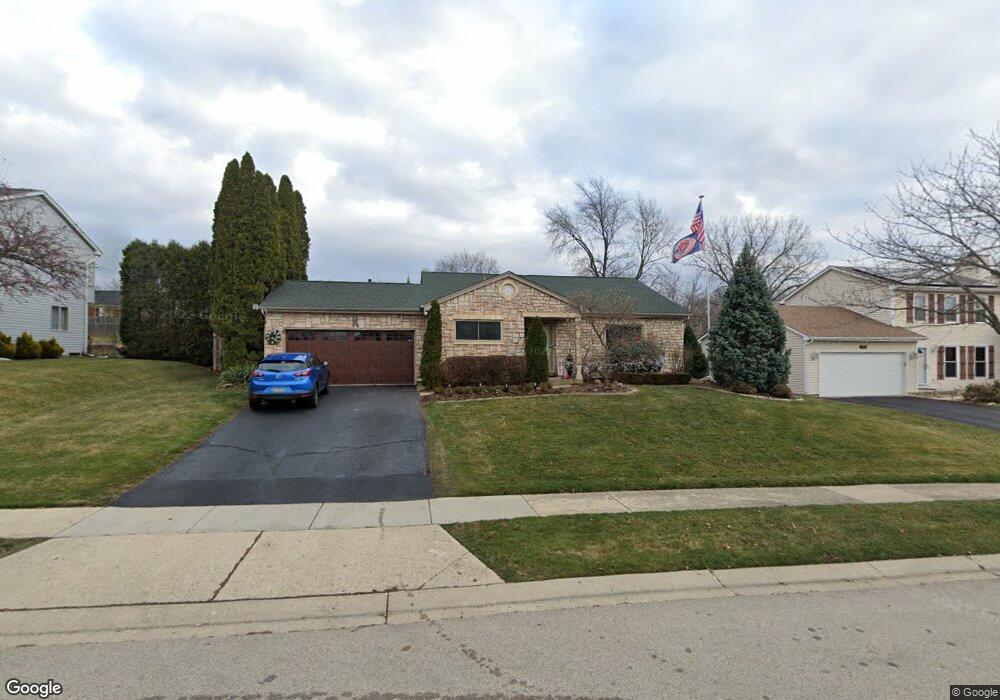
About This Home
This home is located at 451 Candlewood Ct, Algonquin, IL 60102 and is currently estimated at $346,093, approximately $358 per square foot. 451 Candlewood Ct is a home located in McHenry County with nearby schools including Westfield Community School, Kenneth E Neubert Elementary School, and Harry D Jacobs High School.
Ownership History
Date
Name
Owned For
Owner Type
Purchase Details
Closed on
Oct 14, 2005
Sold by
Iverson Clifford and Leah Iverson M
Bought by
Rebacz Christopher J and Rebacz Loreta
Current Estimated Value
Home Financials for this Owner
Home Financials are based on the most recent Mortgage that was taken out on this home.
Original Mortgage
$54,100
Outstanding Balance
$757
Interest Rate
5.8%
Mortgage Type
Unknown
Estimated Equity
$345,336
Purchase Details
Closed on
Jun 14, 2001
Sold by
Mason Earl and Mason Camille A
Bought by
Iverson Clifford and Leah Iverson M
Home Financials for this Owner
Home Financials are based on the most recent Mortgage that was taken out on this home.
Original Mortgage
$171,535
Interest Rate
7.14%
Mortgage Type
FHA
Create a Home Valuation Report for This Property
The Home Valuation Report is an in-depth analysis detailing your home's value as well as a comparison with similar homes in the area
Home Values in the Area
Average Home Value in this Area
Purchase History
| Date | Buyer | Sale Price | Title Company |
|---|---|---|---|
| Rebacz Christopher J | $216,500 | Republic Title Company | |
| Iverson Clifford | $174,000 | -- |
Source: Public Records
Mortgage History
| Date | Status | Borrower | Loan Amount |
|---|---|---|---|
| Open | Rebacz Christopher J | $54,100 | |
| Open | Rebacz Christopher J | $151,500 | |
| Previous Owner | Iverson Clifford | $171,535 |
Source: Public Records
Tax History
| Year | Tax Paid | Tax Assessment Tax Assessment Total Assessment is a certain percentage of the fair market value that is determined by local assessors to be the total taxable value of land and additions on the property. | Land | Improvement |
|---|---|---|---|---|
| 2024 | $6,676 | $93,341 | $23,848 | $69,493 |
| 2023 | $6,319 | $83,482 | $21,329 | $62,153 |
| 2022 | $5,870 | $74,449 | $21,044 | $53,405 |
| 2021 | $5,622 | $69,358 | $19,605 | $49,753 |
| 2020 | $5,469 | $66,903 | $18,911 | $47,992 |
| 2019 | $5,329 | $64,034 | $18,100 | $45,934 |
| 2018 | $5,066 | $59,154 | $16,721 | $42,433 |
| 2017 | $4,952 | $55,727 | $15,752 | $39,975 |
| 2016 | $4,865 | $52,267 | $14,774 | $37,493 |
| 2013 | -- | $49,447 | $13,783 | $35,664 |
Source: Public Records
Map
Nearby Homes
- 313 Bayberry Dr
- 615 Harper Dr
- 909 Roger St
- 1354 Essex St Unit 2
- 1431 Essex St
- 700 Fairfield Ln
- 1 Grandview Ct Unit 8
- SWC Talaga and Algonquin Rd
- 21 Division St
- 407 La Fox River Dr
- 298 Apache Trail
- 108 La Fox Dr
- LOT 3 Blackhawk Dr
- 935 Viewpoint Dr
- 1200 Hillside View
- 944 Cynthia Ln
- 1621 Glengarry Ct Unit 131
- 1002 Interloch Ct Unit 152
- 621 Kirkland Dr
- 338 Hiawatha Dr
- 441 Candlewood Ct
- 461 Candlewood Ct
- 831 Butterfield Dr
- 821 Butterfield Dr
- 431 Candlewood Ct
- 450 Candlewood Ct
- 841 Butterfield Dr
- 811 Butterfield Dr
- 471 Candlewood Ct
- 440 Candlewood Ct
- 851 Butterfield Dr
- 421 Candlewood Ct
- 430 Candlewood Ct Unit 5
- 1121 Sandpebble Cir
- 1111 Sandpebble Cir
- 801 Butterfield Dr
- 1101 Sandpebble Cir
- 441 Shagbark Ct
- 420 Candlewood Ct
- 861 Butterfield Dr
Your Personal Tour Guide
Ask me questions while you tour the home.