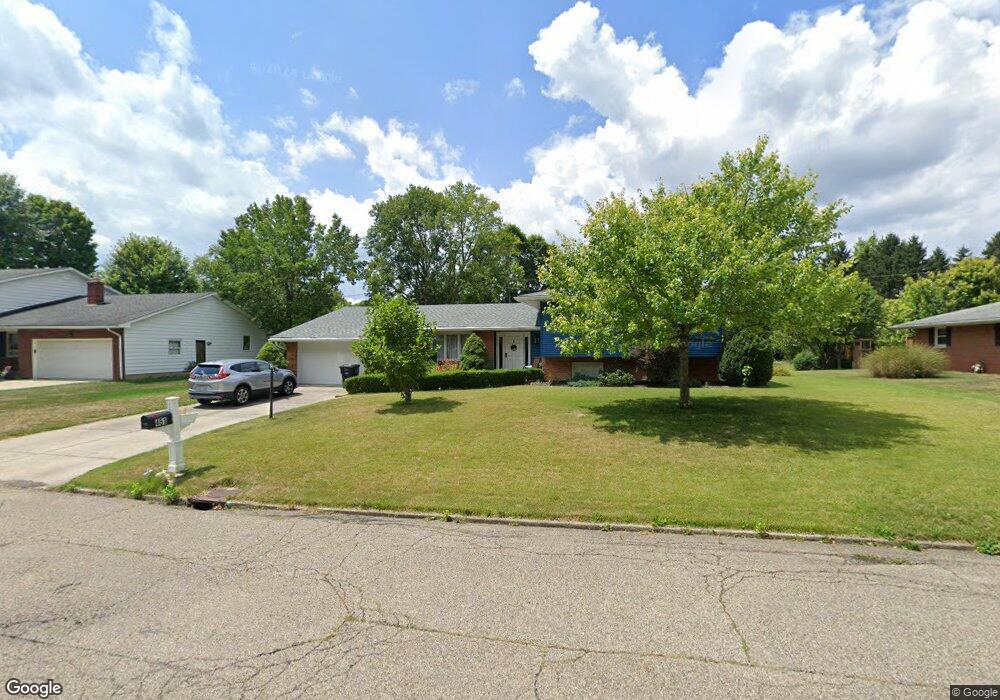
451 Crestview Dr NE Lancaster, OH 43130
Estimated Value: $332,000 - $366,000
3
Beds
3
Baths
2,612
Sq Ft
$134/Sq Ft
Est. Value
About This Home
This home is located at 451 Crestview Dr NE, Lancaster, OH 43130 and is currently estimated at $349,043, approximately $133 per square foot. 451 Crestview Dr NE is a home located in Fairfield County with nearby schools including Thomas Ewing Junior High School, Lancaster High School, and St Bernadette Elementary School.
Ownership History
Date
Name
Owned For
Owner Type
Purchase Details
Closed on
Nov 25, 2024
Sold by
Kauffman Todd A
Bought by
Kauffman Todd A and Kaufman Jennifer
Current Estimated Value
Purchase Details
Closed on
Nov 14, 2019
Sold by
Miller Ronald K
Bought by
Kauffman Todd A
Home Financials for this Owner
Home Financials are based on the most recent Mortgage that was taken out on this home.
Original Mortgage
$175,500
Interest Rate
3.5%
Mortgage Type
Commercial
Purchase Details
Closed on
Aug 15, 2000
Sold by
Pinney Reba
Bought by
Miller Ronald K and Miller Judith S
Home Financials for this Owner
Home Financials are based on the most recent Mortgage that was taken out on this home.
Original Mortgage
$65,000
Interest Rate
8.24%
Mortgage Type
New Conventional
Purchase Details
Closed on
Aug 15, 1997
Sold by
Virgil R Poling Est
Bought by
Pinney Reba
Create a Home Valuation Report for This Property
The Home Valuation Report is an in-depth analysis detailing your home's value as well as a comparison with similar homes in the area
Home Values in the Area
Average Home Value in this Area
Purchase History
| Date | Buyer | Sale Price | Title Company |
|---|---|---|---|
| Kauffman Todd A | -- | Hocking Valley Title | |
| Kauffman Todd A | -- | Hocking Valley Title | |
| Kauffman Todd A | $195,000 | Valmer Land Title Agency | |
| Miller Ronald K | $165,000 | -- | |
| Pinney Reba | $148,000 | -- |
Source: Public Records
Mortgage History
| Date | Status | Borrower | Loan Amount |
|---|---|---|---|
| Previous Owner | Kauffman Todd A | $175,500 | |
| Previous Owner | Miller Ronald K | $65,000 |
Source: Public Records
Tax History
| Year | Tax Paid | Tax Assessment Tax Assessment Total Assessment is a certain percentage of the fair market value that is determined by local assessors to be the total taxable value of land and additions on the property. | Land | Improvement |
|---|---|---|---|---|
| 2025 | $6,890 | $98,490 | $24,120 | $74,370 |
| 2024 | $6,890 | $76,640 | $15,950 | $60,690 |
| 2023 | $2,787 | $76,640 | $15,950 | $60,690 |
| 2022 | $2,799 | $76,640 | $15,950 | $60,690 |
| 2021 | $2,661 | $68,260 | $15,950 | $52,310 |
| 2020 | $2,674 | $68,260 | $15,950 | $52,310 |
| 2019 | $2,113 | $68,260 | $15,950 | $52,310 |
| 2018 | $1,721 | $54,560 | $15,950 | $38,610 |
| 2017 | $1,721 | $54,780 | $14,470 | $40,310 |
| 2016 | $1,677 | $54,780 | $14,470 | $40,310 |
| 2015 | $1,735 | $54,980 | $14,470 | $40,510 |
| 2014 | $1,653 | $54,980 | $14,470 | $40,510 |
| 2013 | $1,653 | $54,980 | $14,470 | $40,510 |
Source: Public Records
Map
Nearby Homes
- 145 Crown Ct
- 1234 Stonehouse Ct Unit 1234
- 1286 Stonehill Ln
- 1275 Stonington Ct Unit 1275
- 105 Dogwood Ln
- 1434 Pleasantville Rd
- 274 Kanawha Rd
- 1376 Frederick St
- 1306 Shumaker Ave
- 1285 Huffer Ave
- 0 E Main St Unit 225040917
- 1254 E Fair Ave
- 1281 E Allen St
- 1804 Pleasantville Rd
- 0 Tiki Ln
- 0 Quarry Rd SE Unit 225041319
- 630 Sheridan Dr
- 138 N Ewing St
- 641 Sheridan Dr
- 627 Sheridan Dr
- 459 Crestview Dr NE
- 443 Crestview Dr NE
- 183 Terrace Ct
- 179 Terrace Ct
- 105 Crown Ct
- 469 Crestview Dr NE
- 435 Crestview Dr NE
- 106 Crown Ct
- 186 Terrace Ct
- 466 Crestview Dr NE
- 163 Terrace Ct
- 475 Crestview Dr NE
- 107 Terrace Ct
- 182 Terrace Ct
- 426 Crestview Dr NE
- 1300 Wheeling Rd NE
- 1308 Wheeling Rd NE
- 106 Honor Ct
- 114 Crown Ct
- 1290 Wheeling Rd NE
Your Personal Tour Guide
Ask me questions while you tour the home.