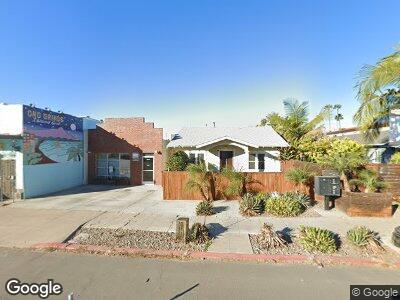
4510-16 30th St San Diego, CA 92116
North Park NeighborhoodEstimated Value: $3,082,836
5
Beds
5
Baths
2,847
Sq Ft
$1,083/Sq Ft
Est. Value
About This Home
This home is located at 4510-16 30th St, San Diego, CA 92116 and is currently estimated at $3,082,836, approximately $1,082 per square foot. 4510-16 30th St is a home located in San Diego County with nearby schools including Garfield Elementary, Roosevelt International Middle School, and San Diego Global Vision Academy.
Ownership History
Date
Name
Owned For
Owner Type
Purchase Details
Closed on
Nov 16, 2021
Sold by
No Park Units Llc
Bought by
Vandamme Kenneth R and Vandamme Van Damme
Current Estimated Value
Purchase Details
Closed on
Nov 1, 2016
Sold by
Witt Diana E
Bought by
No Park Units Llc
Home Financials for this Owner
Home Financials are based on the most recent Mortgage that was taken out on this home.
Original Mortgage
$1,415,000
Interest Rate
3.52%
Mortgage Type
Commercial
Purchase Details
Closed on
Apr 20, 2016
Sold by
Transpose Llc
Bought by
Witt Diana E
Purchase Details
Closed on
Feb 12, 2016
Sold by
Leary John J O
Bought by
Transpose Llc
Home Financials for this Owner
Home Financials are based on the most recent Mortgage that was taken out on this home.
Original Mortgage
$644,000
Interest Rate
3.92%
Mortgage Type
Commercial
Purchase Details
Closed on
Oct 29, 1987
Bought by
Oleary John J
Create a Home Valuation Report for This Property
The Home Valuation Report is an in-depth analysis detailing your home's value as well as a comparison with similar homes in the area
Home Values in the Area
Average Home Value in this Area
Purchase History
| Date | Buyer | Sale Price | Title Company |
|---|---|---|---|
| Vandamme Kenneth R | $2,550,000 | Chicago Title Company | |
| No Park Units Llc | -- | None Available | |
| Witt Diana E | $1,150,000 | Fidelity National Title | |
| Transpose Llc | $765,000 | Fidelity National Title | |
| Oleary John J | $195,000 | -- |
Source: Public Records
Mortgage History
| Date | Status | Borrower | Loan Amount |
|---|---|---|---|
| Previous Owner | No Park Units Llc | $1,415,000 | |
| Previous Owner | Transpose Llc | $644,000 | |
| Previous Owner | Oleary John J | $165,000 |
Source: Public Records
Tax History Compared to Growth
Tax History
| Year | Tax Paid | Tax Assessment Tax Assessment Total Assessment is a certain percentage of the fair market value that is determined by local assessors to be the total taxable value of land and additions on the property. | Land | Improvement |
|---|---|---|---|---|
| 2024 | $32,344 | $2,627,010 | $1,040,400 | $1,586,610 |
| 2023 | $31,630 | $2,575,500 | $1,020,000 | $1,555,500 |
| 2022 | $30,801 | $2,525,000 | $1,000,000 | $1,525,000 |
| 2021 | $15,278 | $1,233,030 | $857,761 | $375,269 |
| 2020 | $15,093 | $1,220,388 | $848,966 | $371,422 |
| 2019 | $14,824 | $1,196,460 | $832,320 | $364,140 |
| 2018 | $13,859 | $1,173,000 | $816,000 | $357,000 |
| 2017 | $13,530 | $1,150,000 | $800,000 | $350,000 |
| 2016 | $3,776 | $315,278 | $226,360 | $88,918 |
| 2015 | $3,721 | $310,543 | $222,960 | $87,583 |
| 2014 | $3,665 | $304,461 | $218,593 | $85,868 |
Source: Public Records
Map
Nearby Homes
- 4473 30th St Unit 216
- 4473 30th St Unit 403
- 4473 30th St Unit 406
- 4473 30th St Unit 201
- 4473 30th St Unit 212
- 4473 30th St Unit 506
- 4473 30th St Unit 505
- 4473 30th St Unit 206
- 4473 30th St Unit 213
- 4473 30th St Unit 203
- 4473 30th St Unit 509
- 4473 30th St Unit 205
- 4580 Ohio St Unit 23
- 4522 Utah St Unit 4
- 4658 Ohio St
- 2889-91 Adams Ave
- 2820 Adams Ave
- 2144 El Cajon Blvd Unit 29 & 30
- 4663 Iowa St Unit 7
- 3204 Madison Ave