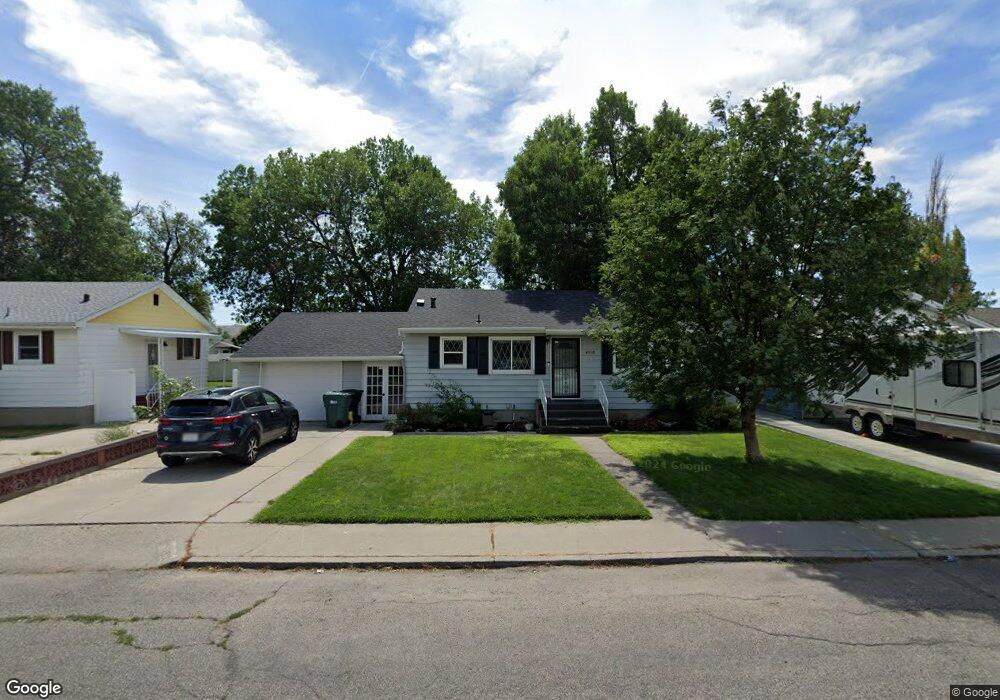
4510 Vaughn Ln Billings, MT 59101
South Central Billings NeighborhoodEstimated Value: $267,000 - $299,000
3
Beds
2
Baths
1,768
Sq Ft
$161/Sq Ft
Est. Value
About This Home
This home is located at 4510 Vaughn Ln, Billings, MT 59101 and is currently estimated at $284,213, approximately $160 per square foot. 4510 Vaughn Ln is a home located in Yellowstone County with nearby schools including Newman School, Riverside Junior High School, and Billings West High School.
Ownership History
Date
Name
Owned For
Owner Type
Purchase Details
Closed on
May 17, 2021
Sold by
Reiter Ashley M and Reiter Scott A
Bought by
Reiter Ashley M and Dechau Kai
Current Estimated Value
Home Financials for this Owner
Home Financials are based on the most recent Mortgage that was taken out on this home.
Original Mortgage
$184,094
Outstanding Balance
$165,854
Interest Rate
3%
Mortgage Type
FHA
Estimated Equity
$118,359
Purchase Details
Closed on
Nov 4, 2019
Sold by
Schrock Diana
Bought by
Reiter Ashley M and Reiter Scott A
Home Financials for this Owner
Home Financials are based on the most recent Mortgage that was taken out on this home.
Original Mortgage
$182,532
Interest Rate
3.65%
Mortgage Type
FHA
Purchase Details
Closed on
Jun 12, 2007
Sold by
Kite Timothy L
Bought by
Schrock Diana
Home Financials for this Owner
Home Financials are based on the most recent Mortgage that was taken out on this home.
Original Mortgage
$146,300
Interest Rate
6.14%
Mortgage Type
Purchase Money Mortgage
Create a Home Valuation Report for This Property
The Home Valuation Report is an in-depth analysis detailing your home's value as well as a comparison with similar homes in the area
Home Values in the Area
Average Home Value in this Area
Purchase History
| Date | Buyer | Sale Price | Title Company |
|---|---|---|---|
| Reiter Ashley M | -- | Chicago Title | |
| Reiter Ashley M | -- | -- | |
| Schrock Diana | -- | None Available |
Source: Public Records
Mortgage History
| Date | Status | Borrower | Loan Amount |
|---|---|---|---|
| Open | Reiter Ashley M | $184,094 | |
| Previous Owner | Reiter Ashley M | $182,532 | |
| Previous Owner | Schrock Diana | $146,300 |
Source: Public Records
Tax History Compared to Growth
Tax History
| Year | Tax Paid | Tax Assessment Tax Assessment Total Assessment is a certain percentage of the fair market value that is determined by local assessors to be the total taxable value of land and additions on the property. | Land | Improvement |
|---|---|---|---|---|
| 2025 | $2,353 | $282,000 | $40,016 | $241,984 |
| 2024 | $2,353 | $227,700 | $39,514 | $188,186 |
| 2023 | $2,353 | $227,700 | $39,514 | $188,186 |
| 2022 | $2,263 | $193,500 | $32,289 | $161,211 |
| 2021 | $2,156 | $193,500 | $0 | $0 |
| 2020 | $2,197 | $187,900 | $0 | $0 |
| 2019 | $2,014 | $178,800 | $0 | $0 |
| 2018 | $1,831 | $157,200 | $0 | $0 |
| 2017 | $1,783 | $157,200 | $0 | $0 |
| 2016 | $1,793 | $161,100 | $0 | $0 |
| 2015 | $1,756 | $161,100 | $0 | $0 |
| 2014 | $1,485 | $70,649 | $0 | $0 |
Source: Public Records
Map
Nearby Homes
- 4444 Morgan Ave
- 4413 Ryan Ave
- 307 S Billings Blvd Unit 36
- 605 Calhoun Ln
- 4611 Murphy Ave
- 328 Viceroy St
- 418 Cook Ave
- 342 Jackson St
- 43 Prickett Ln
- 329 Jackson St
- 618 & 620 Howard Ave
- 723 Cook Ave
- 4131 Buchanan Ave
- 48 Jackson St
- 716 Howard Ave
- 3939 3rd Ave S
- 137 Jefferson St
- 702 Terry Ave
- 704 Terry Ave
- 325 Terry Ave