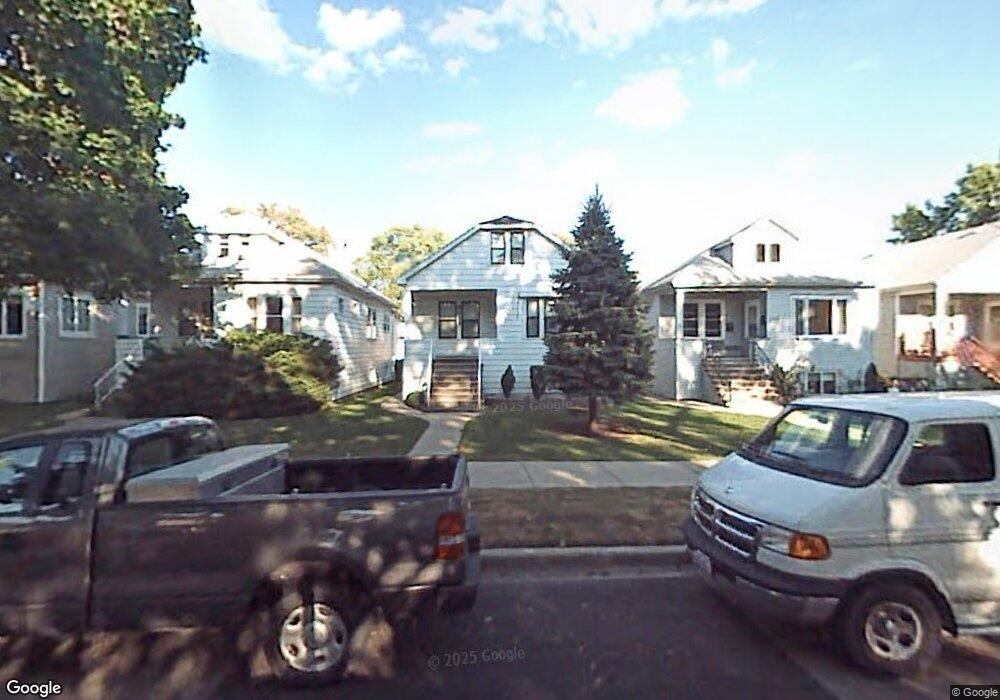
4511 N Moody Ave Chicago, IL 60630
Jefferson Park NeighborhoodEstimated Value: $347,000 - $423,000
3
Beds
2
Baths
1,353
Sq Ft
$280/Sq Ft
Est. Value
About This Home
This home is located at 4511 N Moody Ave, Chicago, IL 60630 and is currently estimated at $379,252, approximately $280 per square foot. 4511 N Moody Ave is a home located in Cook County with nearby schools including Smyser Elementary School, William Howard Taft High School, and St. Robert Bellarmine Catholic School.
Ownership History
Date
Name
Owned For
Owner Type
Purchase Details
Closed on
May 23, 2019
Sold by
Yracheta John Yracheta and Yracheta Judy
Bought by
Yracheta John and Yracheta Judy
Current Estimated Value
Home Financials for this Owner
Home Financials are based on the most recent Mortgage that was taken out on this home.
Original Mortgage
$150,000
Outstanding Balance
$132,329
Interest Rate
4.37%
Mortgage Type
New Conventional
Estimated Equity
$246,923
Purchase Details
Closed on
May 11, 1998
Sold by
Mikkelsen Peter T and Mikkelsen Susan I
Bought by
Yracheta John and Yracheta Judy
Home Financials for this Owner
Home Financials are based on the most recent Mortgage that was taken out on this home.
Original Mortgage
$129,150
Interest Rate
7.19%
Mortgage Type
FHA
Purchase Details
Closed on
Sep 29, 1997
Sold by
Gully Robert F
Bought by
Mikkelsen Peter T and Mikkelsen Susan I
Create a Home Valuation Report for This Property
The Home Valuation Report is an in-depth analysis detailing your home's value as well as a comparison with similar homes in the area
Home Values in the Area
Average Home Value in this Area
Purchase History
| Date | Buyer | Sale Price | Title Company |
|---|---|---|---|
| Yracheta John | -- | Ravenswood Title Company Llc | |
| Yracheta John | $130,000 | Ticor Title Insurance | |
| Mikkelsen Peter T | $82,000 | -- |
Source: Public Records
Mortgage History
| Date | Status | Borrower | Loan Amount |
|---|---|---|---|
| Open | Yracheta John | $150,000 | |
| Closed | Yracheta John | $129,150 |
Source: Public Records
Tax History Compared to Growth
Tax History
| Year | Tax Paid | Tax Assessment Tax Assessment Total Assessment is a certain percentage of the fair market value that is determined by local assessors to be the total taxable value of land and additions on the property. | Land | Improvement |
|---|---|---|---|---|
| 2024 | $391 | $34,000 | $14,217 | $19,783 |
| 2023 | $394 | $30,151 | $11,374 | $18,777 |
| 2022 | $394 | $30,151 | $11,374 | $18,777 |
| 2021 | $375 | $28,999 | $11,373 | $17,626 |
| 2020 | $387 | $28,138 | $5,077 | $23,061 |
| 2019 | $386 | $25,125 | $5,077 | $20,048 |
| 2018 | $380 | $25,125 | $5,077 | $20,048 |
| 2017 | $2,853 | $19,328 | $4,468 | $14,860 |
| 2016 | $3,371 | $19,328 | $4,468 | $14,860 |
| 2015 | $3,311 | $20,692 | $4,468 | $16,224 |
| 2014 | $3,179 | $19,703 | $4,062 | $15,641 |
| 2013 | $3,105 | $19,703 | $4,062 | $15,641 |
Source: Public Records
Map
Nearby Homes
- 4442 N Melvina Ave
- 4447 N Merrimac Ave
- 4567 N Merrimac Ave
- 4518 N Merrimac Ave
- 4546 N Merrimac Ave
- 4526 N Mobile Ave
- 5940 W Wilson Ave
- 4345 N Mcvicker Ave
- 6137 W Giddings St
- 5942 W Eastwood Ave
- 4702 N Austin Ave Unit 302
- 4544 N Mulligan Ave
- 6046 W Giddings St
- 4433 N Narragansett Ave
- 4305 N Mobile Ave
- 4240 N Mcvicker Ave
- 4414 N Monitor Ave
- 6228 W Lawrence Ave
- 5921 W Lawrence Ave
- 6352 W Giddings St
- 4509 N Moody Ave
- 4515 N Moody Ave
- 4505 N Moody Ave
- 4519 N Moody Ave
- 4521 N Moody Ave
- 4501 N Moody Ave
- 4525 N Moody Ave
- 4510 N Meade Ave
- 4514 N Meade Ave
- 4506 N Meade Ave
- 4518 N Meade Ave
- 4504 N Meade Ave
- 4529 N Moody Ave
- 4520 N Meade Ave
- 4500 N Meade Ave
- 4506 N Moody Ave
- 4524 N Meade Ave
- 4510 N Moody Ave
- 4533 N Moody Ave
- 4514 N Moody Ave