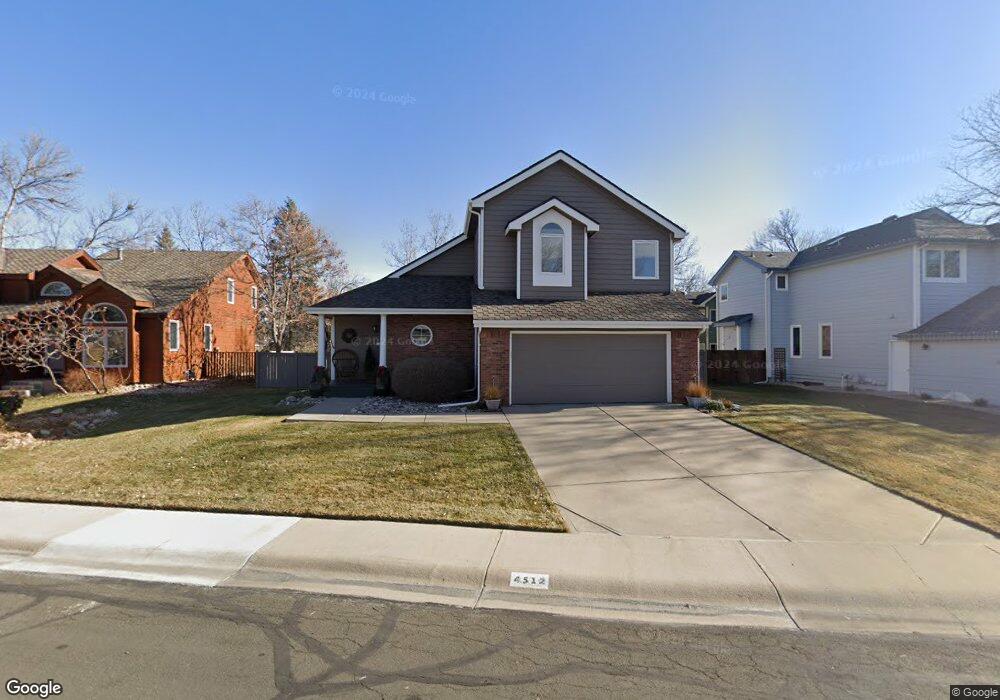
4512 Seaboard Ln Fort Collins, CO 80525
The Landings NeighborhoodEstimated Value: $674,097 - $723,000
4
Beds
4
Baths
2,155
Sq Ft
$321/Sq Ft
Est. Value
About This Home
This home is located at 4512 Seaboard Ln, Fort Collins, CO 80525 and is currently estimated at $692,524, approximately $321 per square foot. 4512 Seaboard Ln is a home located in Larimer County with nearby schools including Kruse Elementary School, Boltz Middle School, and Fort Collins High School.
Ownership History
Date
Name
Owned For
Owner Type
Purchase Details
Closed on
Feb 4, 2025
Sold by
Helmericks Steven George
Bought by
Helmericks Kathie Jo
Current Estimated Value
Purchase Details
Closed on
Feb 6, 2024
Sold by
Helmericks Kathie Jo
Bought by
Helmericks Kathie Jo and Helmericks Steven George
Purchase Details
Closed on
Aug 13, 1997
Sold by
Jewell Alan Mayhall Karen L
Bought by
Helmericks Steven G and Helmericks Kathie J
Home Financials for this Owner
Home Financials are based on the most recent Mortgage that was taken out on this home.
Original Mortgage
$147,050
Interest Rate
9.99%
Purchase Details
Closed on
May 13, 1997
Sold by
Mayhall R A
Bought by
Jewell Alan and Mayhall Karen L
Create a Home Valuation Report for This Property
The Home Valuation Report is an in-depth analysis detailing your home's value as well as a comparison with similar homes in the area
Home Values in the Area
Average Home Value in this Area
Purchase History
| Date | Buyer | Sale Price | Title Company |
|---|---|---|---|
| Helmericks Kathie Jo | -- | None Listed On Document | |
| Helmericks Kathie Jo | -- | None Listed On Document | |
| Helmericks Steven G | $173,000 | -- | |
| Jewell Alan | -- | -- |
Source: Public Records
Mortgage History
| Date | Status | Borrower | Loan Amount |
|---|---|---|---|
| Previous Owner | Helmericks Steven G | $147,050 |
Source: Public Records
Tax History Compared to Growth
Tax History
| Year | Tax Paid | Tax Assessment Tax Assessment Total Assessment is a certain percentage of the fair market value that is determined by local assessors to be the total taxable value of land and additions on the property. | Land | Improvement |
|---|---|---|---|---|
| 2025 | $3,481 | $46,666 | $4,020 | $42,646 |
| 2024 | $3,312 | $46,666 | $4,020 | $42,646 |
| 2022 | $2,520 | $33,638 | $4,170 | $29,468 |
| 2021 | $2,547 | $34,606 | $4,290 | $30,316 |
| 2020 | $2,362 | $32,390 | $4,290 | $28,100 |
| 2019 | $3,044 | $32,390 | $4,290 | $28,100 |
| 2018 | $2,894 | $31,759 | $4,320 | $27,439 |
| 2017 | $2,885 | $31,759 | $4,320 | $27,439 |
| 2016 | $2,756 | $30,184 | $4,776 | $25,408 |
| 2015 | $2,736 | $30,190 | $4,780 | $25,410 |
| 2014 | $2,332 | $25,570 | $4,780 | $20,790 |
Source: Public Records
Map
Nearby Homes
- 4560 Seaboard Ln
- 4579 Seaboard Ln
- 4502 E Boardwalk Dr
- 4506 Seaway Cir
- 4271 Southshore Ct
- 4255 Westshore Way Unit F20
- 4545 Wheaton Dr Unit A240
- 4545 Wheaton Dr Unit B210
- 4545 Wheaton Dr Unit A140
- 1326 Salem St
- 1213 Silk Oak Ct
- 1149 Valley Oak Ct
- 4245 Boardwalk Dr Unit 5
- 1140 Red Oak Ct
- 4212 Cape Cod Cir
- 4218 Cape Cod Cir
- 5220 Boardwalk Dr Unit I21
- 4414 Monaco Place
- 4751 Pleasant Oak Dr Unit C83
- 4751 Pleasant Oak Dr Unit B39
- 4518 Seaboard Ln
- 4506 Seaboard Ln
- 800 Maxwell Ct
- 801 Maxwell Ct
- 806 Maxwell Ct
- 4524 Seaboard Ln
- 801 Whalers Way
- 4513 Seaboard Ln
- 4507 Seaboard Ln
- 4519 Seaboard Ln
- 807 Maxwell Ct
- 807 Whalers Way
- 4501 Seaboard Ln
- 4525 Seaboard Ln
- 812 Maxwell Ct
- 813 Whalers Way
- 813 Maxwell Ct
- 4548 Seaboard Ln
- 4531 Seaboard Ln
- 4566 Seaboard Ln