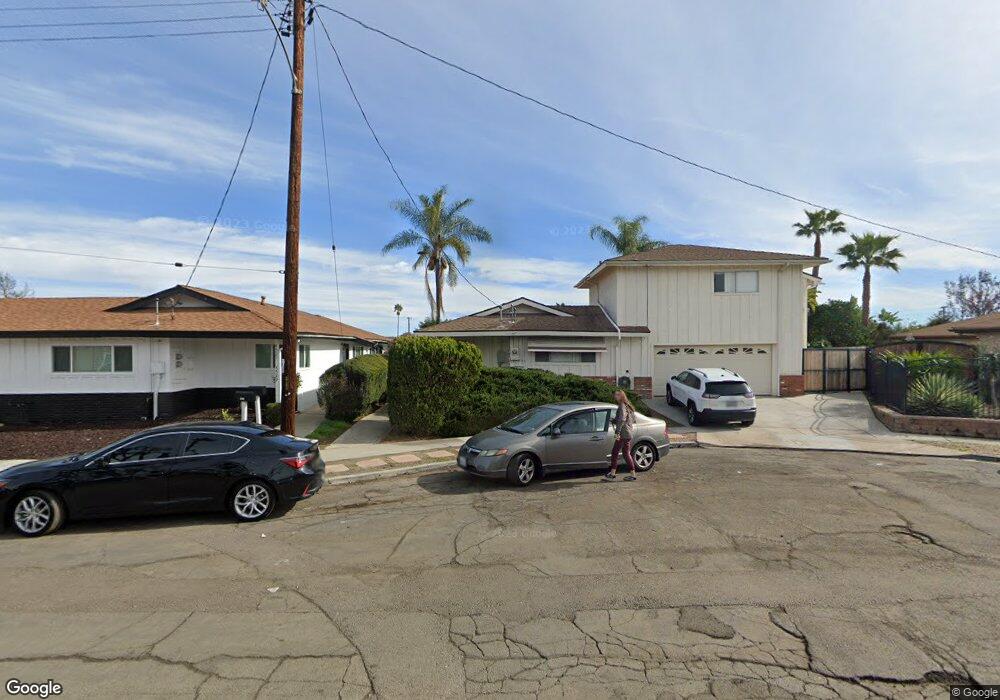
4515 63rd St Unit 17 San Diego, CA 92115
Rolando NeighborhoodEstimated Value: $1,138,000 - $1,946,000
6
Beds
5
Baths
3,305
Sq Ft
$441/Sq Ft
Est. Value
About This Home
This home is located at 4515 63rd St Unit 17, San Diego, CA 92115 and is currently estimated at $1,457,473, approximately $440 per square foot. 4515 63rd St Unit 17 is a home located in San Diego County with nearby schools including Clay Elementary School, Mann Middle School, and Crawford High School.
Ownership History
Date
Name
Owned For
Owner Type
Purchase Details
Closed on
Sep 22, 2015
Sold by
Naismith Sheila
Bought by
Naismith Sheila
Current Estimated Value
Purchase Details
Closed on
Jan 22, 2014
Sold by
Naismith Campbell James and Naismith Sheila
Bought by
Naismith Sheila
Purchase Details
Closed on
Apr 5, 1996
Sold by
Naismith Irene
Bought by
Naismith Irene
Create a Home Valuation Report for This Property
The Home Valuation Report is an in-depth analysis detailing your home's value as well as a comparison with similar homes in the area
Home Values in the Area
Average Home Value in this Area
Purchase History
| Date | Buyer | Sale Price | Title Company |
|---|---|---|---|
| Naismith Sheila | -- | None Available | |
| Naismith Sheila | -- | None Available | |
| Naismith Irene | -- | -- |
Source: Public Records
Tax History Compared to Growth
Tax History
| Year | Tax Paid | Tax Assessment Tax Assessment Total Assessment is a certain percentage of the fair market value that is determined by local assessors to be the total taxable value of land and additions on the property. | Land | Improvement |
|---|---|---|---|---|
| 2025 | $2,254 | $191,339 | $44,092 | $147,247 |
| 2024 | $2,254 | $187,588 | $43,228 | $144,360 |
| 2023 | $2,201 | $183,911 | $42,381 | $141,530 |
| 2022 | $2,141 | $180,305 | $41,550 | $138,755 |
| 2021 | $2,125 | $176,771 | $40,736 | $136,035 |
| 2020 | $2,099 | $174,960 | $40,319 | $134,641 |
| 2019 | $2,060 | $171,530 | $39,529 | $132,001 |
| 2018 | $1,926 | $168,167 | $38,754 | $129,413 |
| 2017 | $1,879 | $164,871 | $37,995 | $126,876 |
| 2016 | $1,846 | $161,639 | $37,250 | $124,389 |
| 2015 | $1,818 | $159,212 | $36,691 | $122,521 |
| 2014 | $1,871 | $156,094 | $35,973 | $120,121 |
Source: Public Records
Map
Nearby Homes
- 4527-29 63rd St
- 4584 Catherine Ave
- 4397 Cartagena Dr
- 4612 Revillo Way
- 6283 Lorca Dr
- 4515 College Way Unit P
- 4777 Seminole Dr Unit 118
- 4727 Choctaw Dr
- 4749 Choctaw Dr
- 4348 College Ave Unit 1
- 4753 Choctaw Dr
- 4560 60th St Unit 11
- 4649 60th St
- 4334 College Ave
- 4540 60th St Unit 303
- 4540 60th St Unit 211
- 4733 Soria Dr
- 4281 College Ave
- 6143 Tarragona Dr
- 5885 El Cajon Blvd Unit 301
- 4527 63rd St
- 4527 63rd St
- 4501 63rd St Unit 3
- 4524 Seminole Dr
- 4518 Seminole Dr
- 4534 Seminole Dr
- 4541 63rd St Unit 43
- 4510 Seminole Dr
- 4544 Seminole Dr
- 4464 Arendo Dr
- 4517 63rd St
- 4529 63rd St
- 4557 63rd St Unit 59
- 4454 Arendo Dr
- 6292 Estelle St
- 4554 Seminole Dr
- 6284 Estelle St
- 4571 63rd St Unit 73
- 6271 Madeline St
- 4564 Seminole Dr