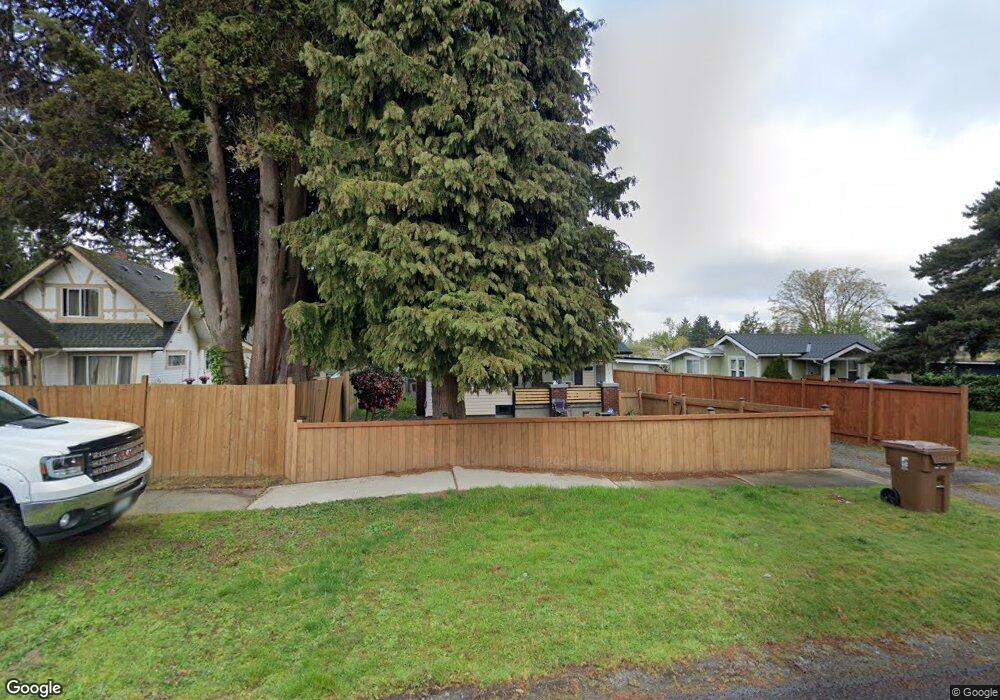
4516 E F St Tacoma, WA 98404
Eastside NeighborhoodEstimated Value: $392,000 - $449,000
3
Beds
1
Bath
1,392
Sq Ft
$307/Sq Ft
Est. Value
About This Home
This home is located at 4516 E F St, Tacoma, WA 98404 and is currently estimated at $426,668, approximately $306 per square foot. 4516 E F St is a home located in Pierce County with nearby schools including Lyon, Hunt Middle School, and Lincoln High School.
Ownership History
Date
Name
Owned For
Owner Type
Purchase Details
Closed on
Jun 11, 1999
Sold by
Glenn Tinthony
Bought by
Mckinney Clarissa
Current Estimated Value
Home Financials for this Owner
Home Financials are based on the most recent Mortgage that was taken out on this home.
Original Mortgage
$97,578
Outstanding Balance
$25,417
Interest Rate
6.9%
Estimated Equity
$401,251
Purchase Details
Closed on
Jul 5, 1995
Sold by
Shupe Robert H and Shupe Dianna L
Bought by
Rhoads Debra A
Home Financials for this Owner
Home Financials are based on the most recent Mortgage that was taken out on this home.
Original Mortgage
$77,454
Interest Rate
7.74%
Mortgage Type
FHA
Create a Home Valuation Report for This Property
The Home Valuation Report is an in-depth analysis detailing your home's value as well as a comparison with similar homes in the area
Home Values in the Area
Average Home Value in this Area
Purchase History
| Date | Buyer | Sale Price | Title Company |
|---|---|---|---|
| Mckinney Clarissa | $87,500 | Transnation Title | |
| Rhoads Debra A | $78,500 | First American Title Ins Co |
Source: Public Records
Mortgage History
| Date | Status | Borrower | Loan Amount |
|---|---|---|---|
| Open | Mckinney Clarissa | $97,578 | |
| Previous Owner | Rhoads Debra A | $77,454 |
Source: Public Records
Tax History Compared to Growth
Tax History
| Year | Tax Paid | Tax Assessment Tax Assessment Total Assessment is a certain percentage of the fair market value that is determined by local assessors to be the total taxable value of land and additions on the property. | Land | Improvement |
|---|---|---|---|---|
| 2025 | $3,948 | $381,700 | $188,700 | $193,000 |
| 2024 | $3,948 | $388,300 | $181,600 | $206,700 |
| 2023 | $3,948 | $354,400 | $169,100 | $185,300 |
| 2022 | $3,681 | $378,200 | $169,100 | $209,100 |
| 2021 | $3,380 | $268,700 | $105,700 | $163,000 |
| 2019 | $2,830 | $242,500 | $88,100 | $154,400 |
| 2018 | $2,960 | $217,500 | $70,500 | $147,000 |
| 2017 | $2,541 | $187,200 | $54,400 | $132,800 |
| 2016 | $2,250 | $135,700 | $40,500 | $95,200 |
| 2014 | $1,999 | $129,300 | $39,300 | $90,000 |
| 2013 | $1,999 | $114,300 | $34,400 | $79,900 |
Source: Public Records
Map
Nearby Homes