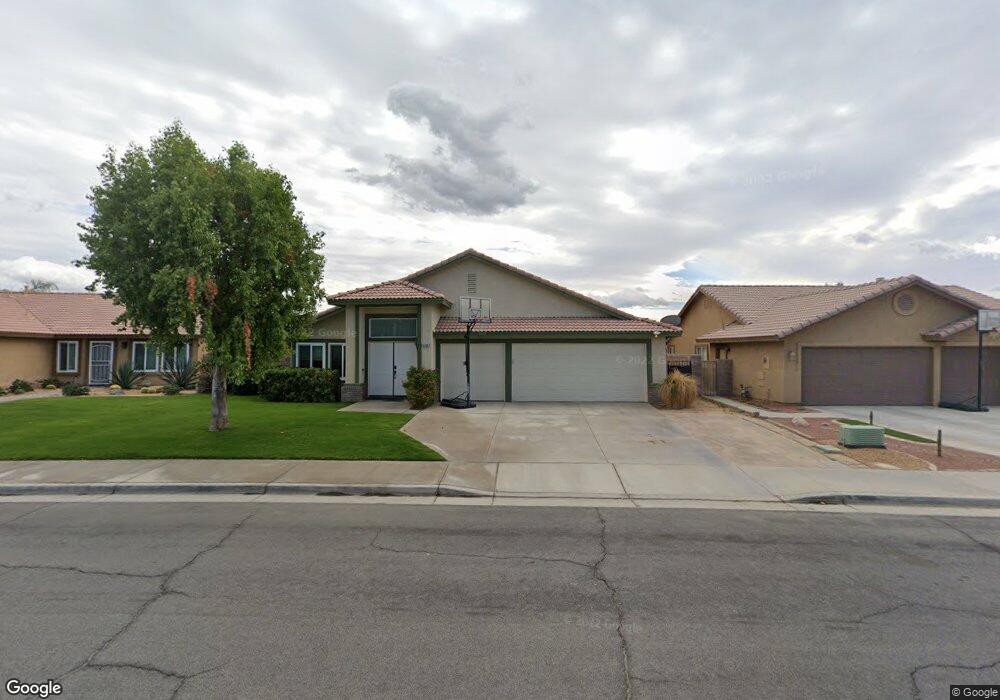
45160 Coldbrook Ln La Quinta, CA 92253
Estimated Value: $535,000 - $670,000
4
Beds
2
Baths
2,008
Sq Ft
$303/Sq Ft
Est. Value
About This Home
This home is located at 45160 Coldbrook Ln, La Quinta, CA 92253 and is currently estimated at $607,851, approximately $302 per square foot. 45160 Coldbrook Ln is a home located in Riverside County with nearby schools including Amelia Earhart Elementary School Of International Studies, John Glenn Middle School Of International Studies, and La Quinta High School.
Ownership History
Date
Name
Owned For
Owner Type
Purchase Details
Closed on
Oct 4, 2023
Sold by
Waters Thomas N and Waters Colleen M
Bought by
Waters Living Trust and Waters
Current Estimated Value
Purchase Details
Closed on
Mar 8, 2001
Sold by
Vass Jennifer Lynn and Vass Dennis Lee
Bought by
Waters Thomas N and Waters Colleen M
Home Financials for this Owner
Home Financials are based on the most recent Mortgage that was taken out on this home.
Original Mortgage
$224,900
Interest Rate
7.06%
Mortgage Type
Purchase Money Mortgage
Purchase Details
Closed on
Nov 17, 1999
Sold by
Usa Investors Ii Llc
Bought by
Vass Jennifer Lynn and Vass Dennis Lee
Home Financials for this Owner
Home Financials are based on the most recent Mortgage that was taken out on this home.
Original Mortgage
$172,337
Interest Rate
8.3%
Mortgage Type
FHA
Create a Home Valuation Report for This Property
The Home Valuation Report is an in-depth analysis detailing your home's value as well as a comparison with similar homes in the area
Purchase History
| Date | Buyer | Sale Price | Title Company |
|---|---|---|---|
| Waters Living Trust | -- | None Listed On Document | |
| Waters Thomas N | $225,000 | Benefit Land Title | |
| Vass Jennifer Lynn | $173,500 | Orange Coast Title |
Source: Public Records
Mortgage History
| Date | Status | Borrower | Loan Amount |
|---|---|---|---|
| Previous Owner | Waters Thomas N | $224,900 | |
| Previous Owner | Vass Jennifer Lynn | $172,337 |
Source: Public Records
Tax History
| Year | Tax Paid | Tax Assessment Tax Assessment Total Assessment is a certain percentage of the fair market value that is determined by local assessors to be the total taxable value of land and additions on the property. | Land | Improvement |
|---|---|---|---|---|
| 2025 | $5,233 | $372,980 | $90,395 | $282,585 |
| 2023 | $5,233 | $358,499 | $86,886 | $271,613 |
| 2022 | $4,918 | $351,471 | $85,183 | $266,288 |
| 2021 | $4,798 | $344,580 | $83,513 | $261,067 |
| 2020 | $4,712 | $341,048 | $82,657 | $258,391 |
| 2019 | $4,619 | $334,362 | $81,037 | $253,325 |
| 2018 | $4,521 | $327,807 | $79,450 | $248,357 |
| 2017 | $4,452 | $321,381 | $77,893 | $243,488 |
| 2016 | $4,368 | $315,080 | $76,366 | $238,714 |
| 2015 | $4,382 | $310,349 | $75,220 | $235,129 |
| 2014 | $4,313 | $304,272 | $73,748 | $230,524 |
Source: Public Records
Map
Nearby Homes
- 45100 Coldbrook Ln
- 79105 Diane Dr
- 45245 Seeley Dr Unit 15G
- 45245 Seeley Dr Unit 17A
- 79140 Diane Dr
- 78670 Bradford Cir
- 45405 Carrie Ln
- 45180 Debbie Dr
- 44930 Tortola Cir
- 44950 Via Catalina
- 44850 Via Catalina
- 79230 Laurie Ct
- 44875 Via Catalina
- 44865 Via Alondra
- 78805 La Palma Dr
- 78500 Via Palomino
- 78440 Via Palomino
- 79300 Desert Stream Dr
- 79320 Desert Stream Dr
- 78370 Via Dijon
- 45190 Coldbrook Ln
- 45130 Coldbrook Ln
- 78800 Birchcrest Cir
- 78810 Birchcrest Cir
- 45210 Coldbrook Ln
- 78820 Birchcrest Cir
- 78790 Birchcrest Cir
- 45075 Coldbrook Ln
- 45055 Coldbrook Ln
- 45230 Coldbrook Ln
- 45070 Coldbrook Ln
- 45175 Summerbrook Ct
- 45155 Sunberry Ct
- 45135 Sunberry Ct
- 78780 Birchcrest Cir
- 45035 Coldbrook Ln
- 45250 Coldbrook Ln
- 45040 Coldbrook Ln
- 45095 Summerbrook Ct
- 78795 Birchcrest Cir
Your Personal Tour Guide
Ask me questions while you tour the home.