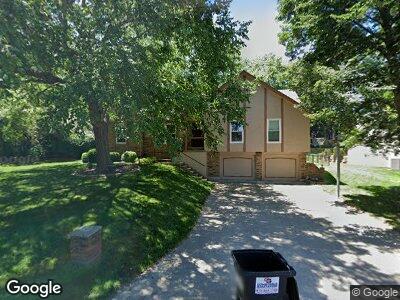
4519 NW Bramble Trail Lees Summit, MO 64064
Chapel Ridge NeighborhoodEstimated Value: $375,386 - $422,000
4
Beds
3
Baths
1,695
Sq Ft
$234/Sq Ft
Est. Value
About This Home
This home is located at 4519 NW Bramble Trail, Lees Summit, MO 64064 and is currently estimated at $396,847, approximately $234 per square foot. 4519 NW Bramble Trail is a home located in Jackson County with nearby schools including Hazel Grove Elementary School, Bernard C. Campbell Middle School, and Lee's Summit North High School.
Ownership History
Date
Name
Owned For
Owner Type
Purchase Details
Closed on
Aug 6, 2019
Sold by
Schie Ber Michael P and Schie Ber Traci E
Bought by
Schieber Michael P and Schieber Traci E
Current Estimated Value
Home Financials for this Owner
Home Financials are based on the most recent Mortgage that was taken out on this home.
Original Mortgage
$198,400
Interest Rate
3.7%
Mortgage Type
New Conventional
Purchase Details
Closed on
Sep 23, 2009
Sold by
Davis Lawrence E and Davis Christine E
Bought by
Schieber Michael P
Home Financials for this Owner
Home Financials are based on the most recent Mortgage that was taken out on this home.
Original Mortgage
$162,894
Interest Rate
5.05%
Mortgage Type
FHA
Purchase Details
Closed on
Nov 2, 1999
Bought by
Davis Lawrence E
Home Financials for this Owner
Home Financials are based on the most recent Mortgage that was taken out on this home.
Original Mortgage
$122,400
Interest Rate
7.85%
Mortgage Type
New Conventional
Create a Home Valuation Report for This Property
The Home Valuation Report is an in-depth analysis detailing your home's value as well as a comparison with similar homes in the area
Home Values in the Area
Average Home Value in this Area
Purchase History
| Date | Buyer | Sale Price | Title Company |
|---|---|---|---|
| Schieber Michael P | -- | None Available | |
| Schieber Michael P | -- | Chicago | |
| Davis Lawrence E | -- | -- |
Source: Public Records
Mortgage History
| Date | Status | Borrower | Loan Amount |
|---|---|---|---|
| Open | Schieber Michael P | $255,000 | |
| Closed | Schieber Michael P | $198,400 | |
| Closed | Schieber Michael P | $177,299 | |
| Closed | Schieber Michael P | $155,700 | |
| Closed | Schieber Michael P | $162,928 | |
| Closed | Schieber Michael P | $162,894 | |
| Previous Owner | Davis Lawrence E | $122,400 |
Source: Public Records
Tax History Compared to Growth
Tax History
| Year | Tax Paid | Tax Assessment Tax Assessment Total Assessment is a certain percentage of the fair market value that is determined by local assessors to be the total taxable value of land and additions on the property. | Land | Improvement |
|---|---|---|---|---|
| 2024 | $4,204 | $58,653 | $11,191 | $47,462 |
| 2023 | $4,204 | $58,653 | $11,191 | $47,462 |
| 2022 | $3,068 | $38,000 | $10,783 | $27,217 |
| 2021 | $3,131 | $38,000 | $10,783 | $27,217 |
| 2020 | $3,013 | $36,210 | $10,783 | $25,427 |
| 2019 | $2,931 | $36,210 | $10,783 | $25,427 |
| 2018 | $921,538 | $31,032 | $4,187 | $26,845 |
| 2017 | $2,635 | $31,032 | $4,187 | $26,845 |
| 2016 | $2,635 | $29,906 | $5,472 | $24,434 |
| 2014 | $2,561 | $28,490 | $5,474 | $23,016 |
Source: Public Records
Map
Nearby Homes
- 4616 NW Bramble Trail
- 302 NW Bramble Trail Cir
- 220 NW Aspen St
- 218 NW Aspen St
- 7120 Lee's Summit Rd
- 7140 Lee's Summit Rd
- 7130 Lee's Summit Rd
- 7100 Lee's Summit Rd
- 220 NW Locust St
- 218 NW Locust St
- 219 NW Locust St
- 129 NE Edgewater Dr
- 234 NE Bayview Dr
- 212 NE Landings Cir
- 4900 NE Maybrook Rd
- 264 NE Edgewater Dr
- 4017 NE Woodridge Dr
- 4011 NE Woodridge Dr
- 217 NW Ponderosa St
- 129 NE Wood Glen Ln
- 4519 NW Bramble Trail
- 4515 NW Bramble Trail
- 4523 NW Bramble Trail
- 4601 NW Bramble Trail
- 4555 NW Bramble Trail
- 4516 NW Bramble Trail
- 4512 NW Bramble Trail
- 4527 NW Bramble Trail
- 4605 NW Bramble Trail
- 4520 NW Bramble Trail
- 4547 NW Bramble Trail
- 4524 NW Bramble Trail
- 4531 NW Bramble Trail
- 4543 NW Bramble Trail
- 4611 NW Bramble Trail
- 4600 NW Bramble Trail
- 4604 NW Bramble Trail
- 4528 NW Bramble Trail
- 4560 NW Bramble Trail
- 4610 NW Bramble Trail