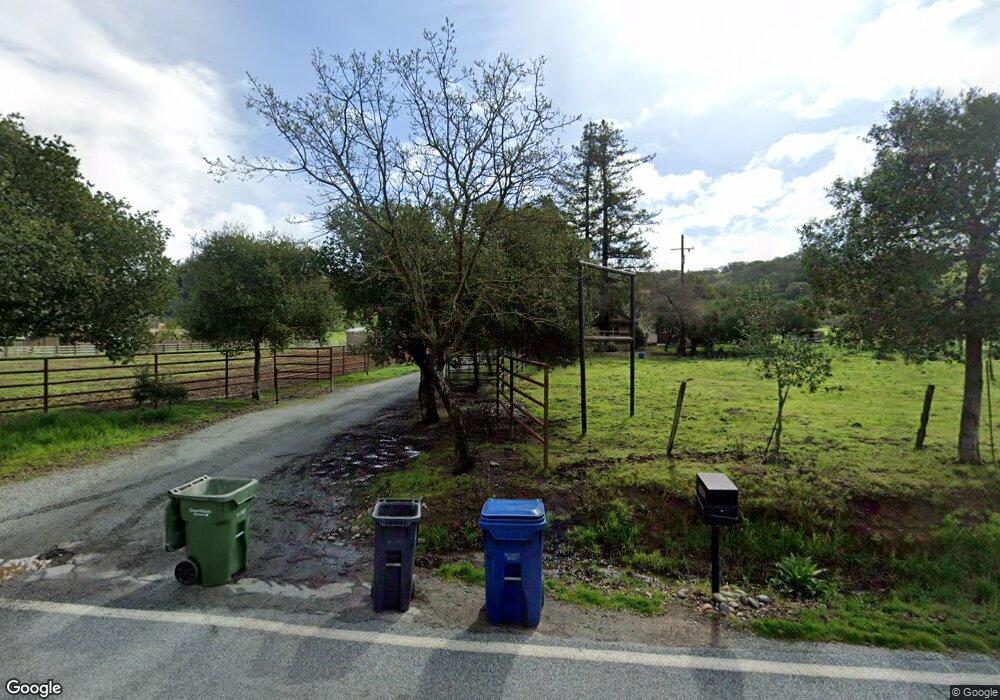
4520 Roop Rd Gilroy, CA 95020
Estimated Value: $1,310,008 - $1,958,000
3
Beds
1
Bath
1,100
Sq Ft
$1,527/Sq Ft
Est. Value
About This Home
This home is located at 4520 Roop Rd, Gilroy, CA 95020 and is currently estimated at $1,679,336, approximately $1,526 per square foot. 4520 Roop Rd is a home located in Santa Clara County with nearby schools including Rucker Elementary School, Solorsano Middle School, and Christopher High School.
Ownership History
Date
Name
Owned For
Owner Type
Purchase Details
Closed on
Sep 26, 2005
Sold by
Asay Douglas D and Asay Nancy E
Bought by
Temperino Vincent E
Current Estimated Value
Home Financials for this Owner
Home Financials are based on the most recent Mortgage that was taken out on this home.
Original Mortgage
$1,575,000
Outstanding Balance
$840,886
Interest Rate
5.72%
Mortgage Type
Fannie Mae Freddie Mac
Estimated Equity
$838,450
Purchase Details
Closed on
Feb 11, 2002
Sold by
Asay Nancy
Bought by
Asay Douglas
Purchase Details
Closed on
Jul 17, 2001
Sold by
House John Q
Bought by
Xchange Solutions Inc
Home Financials for this Owner
Home Financials are based on the most recent Mortgage that was taken out on this home.
Original Mortgage
$300,000
Interest Rate
7.09%
Mortgage Type
Seller Take Back
Purchase Details
Closed on
Sep 19, 2000
Sold by
House Susan F
Bought by
House John Q
Create a Home Valuation Report for This Property
The Home Valuation Report is an in-depth analysis detailing your home's value as well as a comparison with similar homes in the area
Purchase History
| Date | Buyer | Sale Price | Title Company |
|---|---|---|---|
| Temperino Vincent E | $2,250,000 | Alliance Title Company | |
| Asay Douglas | -- | Chicago Title Co | |
| Asay Nancy | -- | Chicago Title Co | |
| Asay Douglas D | -- | Chicago Title Co | |
| Xchange Solutions Inc | $1,200,000 | Chicago Title Co | |
| House John Q | -- | Chicago Title Co | |
| House John Q | -- | Commonwealth Land Title Co | |
| House John Q | $500,000 | Commonwealth Land Title Co | |
| Harlan Noel S | $500,000 | Commonwealth Land Title Co |
Source: Public Records
Mortgage History
| Date | Status | Borrower | Loan Amount |
|---|---|---|---|
| Open | Temperino Vincent E | $1,575,000 | |
| Previous Owner | Xchange Solutions Inc | $300,000 |
Source: Public Records
Tax History
| Year | Tax Paid | Tax Assessment Tax Assessment Total Assessment is a certain percentage of the fair market value that is determined by local assessors to be the total taxable value of land and additions on the property. | Land | Improvement |
|---|---|---|---|---|
| 2025 | $10,893 | $886,903 | $613,598 | $273,305 |
| 2024 | $10,893 | $873,803 | $605,856 | $267,947 |
| 2023 | $10,849 | $859,530 | $596,836 | $262,694 |
| 2022 | $10,680 | $843,434 | $585,890 | $257,544 |
| 2021 | $10,639 | $827,654 | $575,159 | $252,495 |
| 2020 | $10,485 | $817,421 | $567,515 | $249,906 |
| 2019 | $10,371 | $800,190 | $555,184 | $245,006 |
| 2018 | $9,663 | $783,451 | $543,249 | $240,202 |
| 2017 | $9,869 | $768,734 | $533,241 | $235,493 |
| 2016 | $9,656 | $752,742 | $521,866 | $230,876 |
| 2015 | $9,101 | $741,906 | $514,497 | $227,409 |
| 2014 | $8,980 | $726,566 | $503,611 | $222,955 |
Source: Public Records
Map
Nearby Homes
- 9539 Via Del Cielo
- 3970 Leavesley Rd
- 0 New Ave
- 2143 Buena Vista Ave
- 0 Crews Rd
- 2800 Dryden Ave
- 2015 Trumar Ln
- 2055 Rucker Ave
- 2718 Ferguson Rd
- 2712 Ferguson Rd
- 730 Lepa Ct
- 145 Masten Ave
- 615 Rucker Ave
- 0 Buena Vista Ave
- 700 Las Animas Ave
- 0A Buena Vista Ave
- 310 Lena Ave
- 3455 Susie Ln
- 0 Rucker Ave
- 2675 Pacheco Pass Hwy
- 4480 Roop Rd
- 4490 Roop Rd
- 4550 Roop Rd
- 4460 Roop Rd
- 4554 Roop Rd
- 8950 Roop Rd Unit B
- 4420 Roop Rd
- 4440 Roop Rd
- 3800 Blue Oaks Rd
- 3900 Blue Oaks Rd
- 4450 Roop Rd
- 9559 Via Del Cielo
- 9579 Via Del Cielo
- 8930 Leavesley Rd
- 9589 Via Del Cielo
- 2559 Butch Dr
- 8900 Manfroy Ranch Rd
- 2561 Butch Dr
- 9529 Via Del Cielo
- 8950 Manfroy Ranch Rd
Your Personal Tour Guide
Ask me questions while you tour the home.