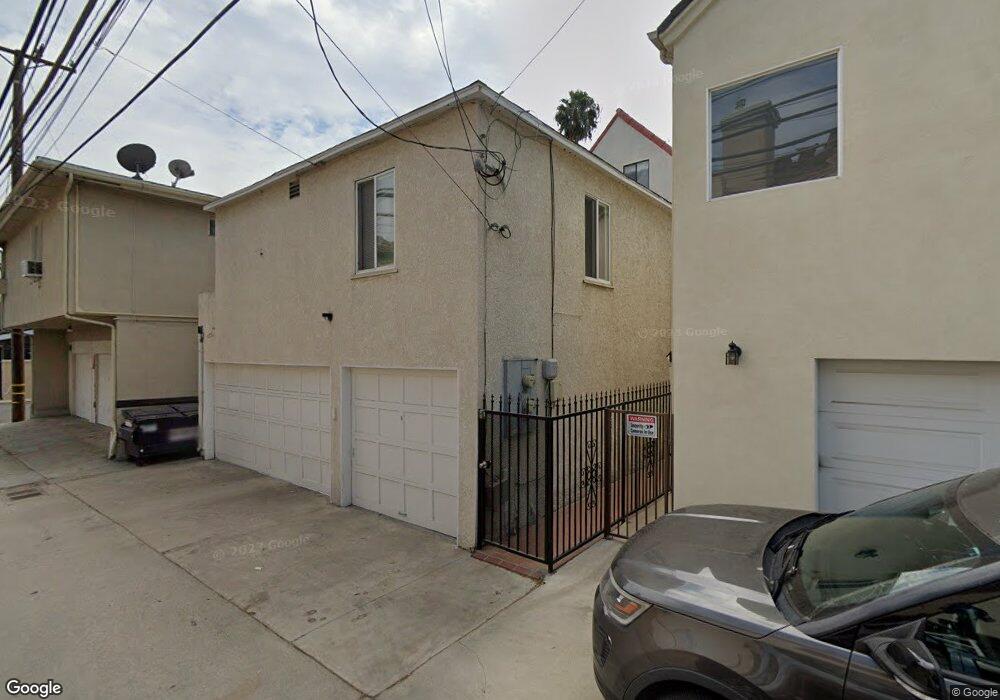
4521 E Ocean Blvd Long Beach, CA 90803
Belmont Shore NeighborhoodEstimated Value: $1,690,000 - $2,062,000
2
Beds
4
Baths
2,954
Sq Ft
$620/Sq Ft
Est. Value
About This Home
This home is located at 4521 E Ocean Blvd, Long Beach, CA 90803 and is currently estimated at $1,831,731, approximately $620 per square foot. 4521 E Ocean Blvd is a home located in Los Angeles County with nearby schools including Lowell Elementary School, Rogers Middle School, and Woodrow Wilson High School.
Ownership History
Date
Name
Owned For
Owner Type
Purchase Details
Closed on
Oct 16, 2007
Sold by
Fleming Wendell A and The Fleming Family Revocable L
Bought by
The Wendell Alexander Fleming June 2007
Current Estimated Value
Purchase Details
Closed on
Jun 20, 2006
Sold by
Fleming Margaret
Bought by
The Fleming Family Revocable Trust
Purchase Details
Closed on
May 23, 2003
Sold by
Fleming Ammie Wendell and Fleming Margaret
Bought by
Fleming A Wendell and Fleming Margaret
Home Financials for this Owner
Home Financials are based on the most recent Mortgage that was taken out on this home.
Original Mortgage
$460,000
Interest Rate
5.75%
Mortgage Type
Purchase Money Mortgage
Create a Home Valuation Report for This Property
The Home Valuation Report is an in-depth analysis detailing your home's value as well as a comparison with similar homes in the area
Home Values in the Area
Average Home Value in this Area
Purchase History
| Date | Buyer | Sale Price | Title Company |
|---|---|---|---|
| The Wendell Alexander Fleming June 2007 | -- | None Available | |
| The Fleming Family Revocable Trust | -- | None Available | |
| Fleming A Wendell | -- | Chicago Title Co |
Source: Public Records
Mortgage History
| Date | Status | Borrower | Loan Amount |
|---|---|---|---|
| Closed | Fleming A Wendell | $460,000 |
Source: Public Records
Tax History
| Year | Tax Paid | Tax Assessment Tax Assessment Total Assessment is a certain percentage of the fair market value that is determined by local assessors to be the total taxable value of land and additions on the property. | Land | Improvement |
|---|---|---|---|---|
| 2025 | $8,403 | $654,152 | $280,153 | $373,999 |
| 2024 | $8,403 | $641,326 | $274,660 | $366,666 |
| 2023 | $8,262 | $628,752 | $269,275 | $359,477 |
| 2022 | $7,758 | $616,425 | $263,996 | $352,429 |
| 2021 | $7,593 | $604,339 | $258,820 | $345,519 |
| 2020 | $7,572 | $598,144 | $256,167 | $341,977 |
| 2019 | $7,482 | $586,417 | $251,145 | $335,272 |
| 2018 | $7,261 | $574,920 | $246,221 | $328,699 |
| 2016 | $6,662 | $552,597 | $236,661 | $315,936 |
| 2015 | $6,394 | $544,298 | $233,107 | $311,191 |
| 2014 | $6,350 | $533,637 | $228,541 | $305,096 |
Source: Public Records
Map
Nearby Homes
- 118 Roycroft Ave
- 28 Argonne Ave
- 104 Saint Joseph Ave
- 74 Argonne Ave
- 111 Ximeno Ave
- 75 Granada Ave
- 4401 E Division St
- 140 Saint Joseph Ave
- 150 Saint Joseph Ave
- 105 Roswell Ave
- 153 Granada Ave
- 132 Belmont Ave
- 116 Termino Ave
- 40 La Verne Ave
- 3811 E Livingston Dr Unit 1
- 16 38th Place
- 219 Ximeno Ave
- 4527 E Shaw St
- 202 Mira Mar Ave
- 66 Pomona Ave
- 4515 E Ocean Blvd
- 5 Quincy Ave
- 4509 E Ocean Blvd
- 19 Quincy Ave
- 4507 E Ocean Blvd
- 25 Quincy Ave
- 4601 E Ocean Blvd
- 22 Prospect Ave
- 2 Prospect Ave
- 33 Quincy Ave
- 28 Prospect Ave
- 22 Quincy Ave
- 4611 E Ocean Blvd
- 4609 E Ocean Blvd
- 30 Quincy Ave
- 39 Quincy Ave
- 38 Quincy Ave
- 4617 E Ocean Blvd
- 4617 E Ocean Blvd Unit 5
- 40 Prospect Ave
Your Personal Tour Guide
Ask me questions while you tour the home.