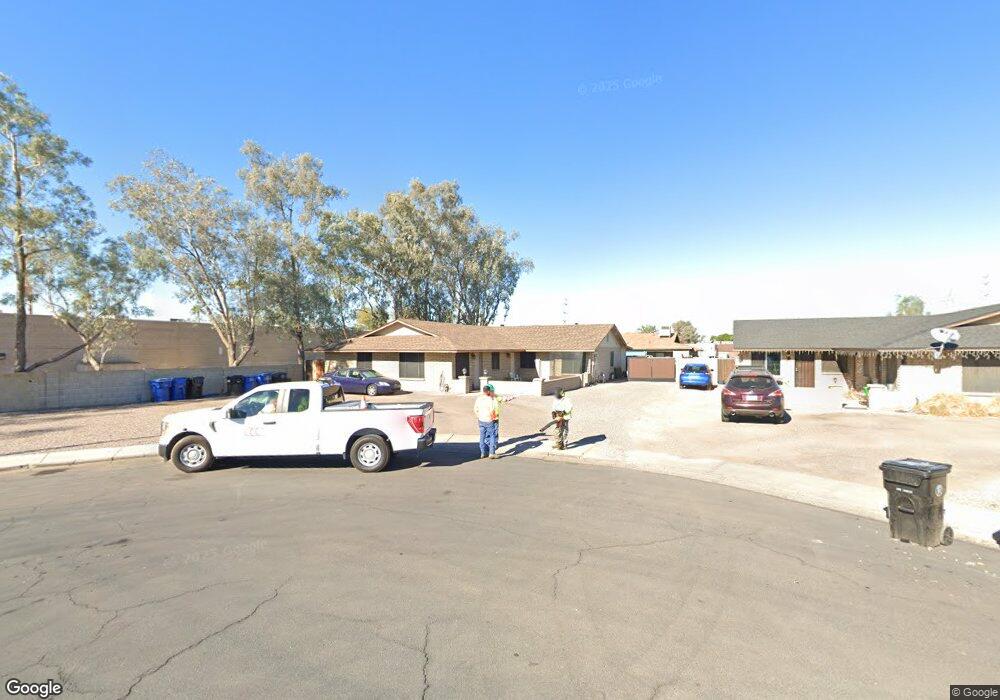
4524 E Caballero Cir Mesa, AZ 85205
Central Mesa East NeighborhoodEstimated Value: $515,926 - $583,000
Studio
--
Bath
2,479
Sq Ft
$224/Sq Ft
Est. Value
About This Home
This home is located at 4524 E Caballero Cir, Mesa, AZ 85205 and is currently estimated at $556,232, approximately $224 per square foot. 4524 E Caballero Cir is a home located in Maricopa County with nearby schools including O'Connor Elementary School, Franklin at Brimhall Elementary School, and Franklin West Elementary School.
Ownership History
Date
Name
Owned For
Owner Type
Purchase Details
Closed on
Aug 11, 2005
Sold by
Minch Mark A and Minch Linda J
Bought by
4524 E Caballero Llc
Current Estimated Value
Purchase Details
Closed on
Sep 7, 2001
Sold by
Cheung Nita C and Hsiao Justin C
Bought by
Minch Mark A and Minch Linda J
Home Financials for this Owner
Home Financials are based on the most recent Mortgage that was taken out on this home.
Original Mortgage
$128,800
Interest Rate
7%
Mortgage Type
New Conventional
Purchase Details
Closed on
Mar 26, 1998
Sold by
Cheung Nita C and Cheung Nita Chun
Bought by
Hsiao Justin C and Cheung Nita C
Purchase Details
Closed on
Mar 11, 1997
Sold by
Solano Ana Maria
Bought by
Hsiao Justin C and Cheung Nita C
Home Financials for this Owner
Home Financials are based on the most recent Mortgage that was taken out on this home.
Original Mortgage
$79,200
Interest Rate
7.74%
Mortgage Type
New Conventional
Create a Home Valuation Report for This Property
The Home Valuation Report is an in-depth analysis detailing your home's value as well as a comparison with similar homes in the area
Home Values in the Area
Average Home Value in this Area
Purchase History
| Date | Buyer | Sale Price | Title Company |
|---|---|---|---|
| 4524 E Caballero Llc | -- | -- | |
| Minch Mark A | $161,000 | Metro Title Agency | |
| Hsiao Justin C | -- | Fidelity Title | |
| Hsiao Justin C | $99,000 | Transnation Title Ins Co |
Source: Public Records
Mortgage History
| Date | Status | Borrower | Loan Amount |
|---|---|---|---|
| Previous Owner | Minch Mark A | $128,800 | |
| Previous Owner | Hsiao Justin C | $79,200 |
Source: Public Records
Tax History
| Year | Tax Paid | Tax Assessment Tax Assessment Total Assessment is a certain percentage of the fair market value that is determined by local assessors to be the total taxable value of land and additions on the property. | Land | Improvement |
|---|---|---|---|---|
| 2025 | $1,486 | $14,618 | -- | -- |
| 2024 | $1,491 | $13,922 | -- | -- |
| 2023 | $1,491 | $38,410 | $7,680 | $30,730 |
| 2022 | $1,461 | $29,710 | $5,940 | $23,770 |
| 2021 | $1,471 | $24,750 | $4,950 | $19,800 |
| 2020 | $1,451 | $22,670 | $4,530 | $18,140 |
| 2019 | $1,358 | $18,230 | $3,640 | $14,590 |
| 2018 | $1,301 | $17,210 | $3,440 | $13,770 |
| 2017 | $1,263 | $14,120 | $2,820 | $11,300 |
| 2016 | $1,239 | $13,460 | $2,690 | $10,770 |
| 2015 | $1,163 | $12,000 | $2,400 | $9,600 |
Source: Public Records
Map
Nearby Homes
- 4530 E Decatur St
- 4700 E Main St Unit 1465
- 4700 E Main St Unit 723
- 4700 E Main St Unit A-17
- 4700 E Main St Unit L12
- 4700 E Main St Unit 510
- 4700 E Main St Unit 422
- 4700 E Main St Unit 398C
- 4700 E Main St Unit 1453
- 4700 E Main St Unit 1232
- 4700 E Main St Unit 1061
- 4700 E Main St Unit 284
- 4700 E Main St Unit 1715
- 4700 E Main St Unit 239
- 4700 E Main St Unit 262
- 4700 E Main St Unit 1080
- 4700 E Main St Unit 416
- 4700 E Main St Unit 2253
- 4700 E Main St Unit 742
- 4700 E Main St Unit 1585
- 4532 E Caballero Cir
- 4523 E Camino Cir
- 4544 E Caballero Cir
- 4531 E Camino Cir
- 4521 E Caballero Cir
- 4543 E Camino Cir
- 4529 E Caballero Cir
- 4541 E Caballero Cir
- 4541 E Caballero Cir Unit 3
- 4541 E Caballero Cir Unit 1
- 4541 E Caballero Cir Unit 2
- 4454 E University Dr
- 4551 E Camino Cir
- 4553 E Caballero Cir
- 4553 E Caballero Cir Unit 1
- 4553 E Caballero Cir Unit 3
- 4553 E Caballero Cir Unit 2
- 4522 E Camino Cir Unit 1
- 4522 E Camino Cir
- 4522 E Camino Cir Unit 2
Your Personal Tour Guide
Ask me questions while you tour the home.