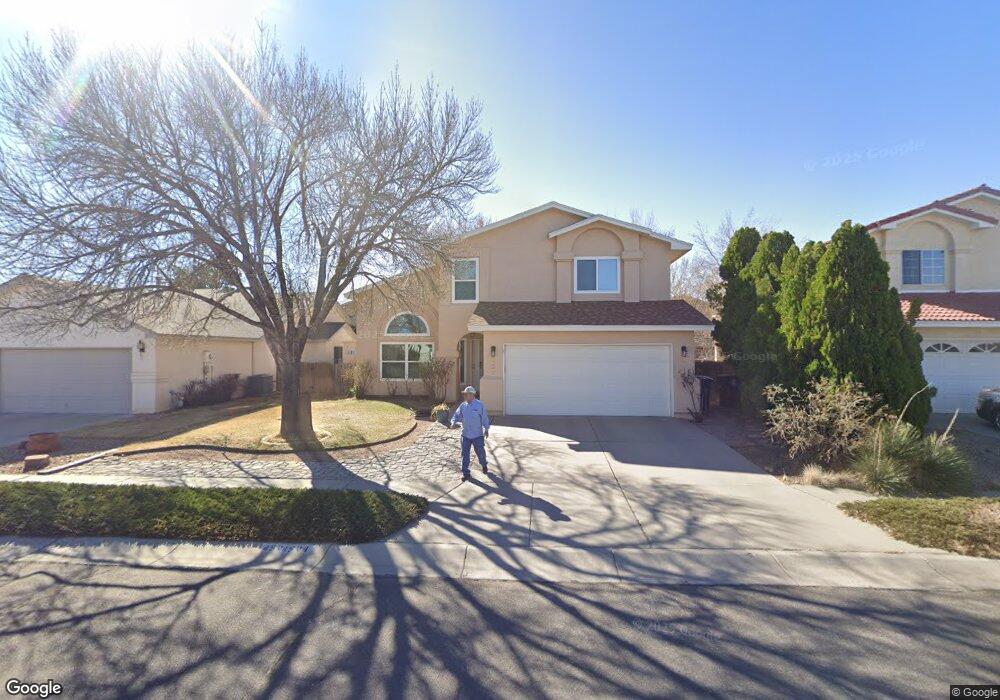
4524 Samara Rd NW Albuquerque, NM 87120
Taylor Ranch NeighborhoodEstimated Value: $357,000 - $378,000
3
Beds
3
Baths
1,850
Sq Ft
$200/Sq Ft
Est. Value
About This Home
This home is located at 4524 Samara Rd NW, Albuquerque, NM 87120 and is currently estimated at $369,659, approximately $199 per square foot. 4524 Samara Rd NW is a home located in Bernalillo County with nearby schools including Chamiza Elementary School, L.B. Johnson Middle School, and Volcano Vista High School.
Ownership History
Date
Name
Owned For
Owner Type
Purchase Details
Closed on
Apr 1, 2019
Sold by
Sanchez Stephen and Sanchez Tina M
Bought by
Sanchez James Stephen
Current Estimated Value
Purchase Details
Closed on
Mar 11, 2003
Sold by
Sanchez Stephen
Bought by
Sanchez Stephen and Sanchez Tina M
Purchase Details
Closed on
Jan 25, 2001
Sold by
Sanchez Stephen and Sanchez Tina M
Bought by
Sanchez Stephen
Home Financials for this Owner
Home Financials are based on the most recent Mortgage that was taken out on this home.
Original Mortgage
$110,200
Outstanding Balance
$40,335
Interest Rate
7.43%
Estimated Equity
$329,324
Purchase Details
Closed on
Jun 1, 2000
Sold by
Sanchez Stephen
Bought by
Sanchez Stephen and Sanchez Tina M
Purchase Details
Closed on
May 19, 2000
Sold by
Sanchez Stephen and Sanchez Tina
Bought by
Sanchez Stephen
Purchase Details
Closed on
May 6, 2000
Sold by
Gonzales Louis J and Gonzales Janet E
Bought by
Sanchez Stephen
Create a Home Valuation Report for This Property
The Home Valuation Report is an in-depth analysis detailing your home's value as well as a comparison with similar homes in the area
Home Values in the Area
Average Home Value in this Area
Purchase History
| Date | Buyer | Sale Price | Title Company |
|---|---|---|---|
| Sanchez James Stephen | -- | None Available | |
| Sanchez Stephen | -- | Fidelity National Title Co | |
| Sanchez Stephen | -- | Fidelity National Title Co | |
| Sanchez Stephen | -- | Fidelity National Title Co | |
| Sanchez Stephen | -- | First American | |
| Sanchez Stephen | -- | First American Title Ins Co | |
| Sanchez Stephen | -- | First American |
Source: Public Records
Mortgage History
| Date | Status | Borrower | Loan Amount |
|---|---|---|---|
| Open | Sanchez Stephen | $110,200 | |
| Closed | Sanchez Stephen | $14,900 |
Source: Public Records
Tax History Compared to Growth
Tax History
| Year | Tax Paid | Tax Assessment Tax Assessment Total Assessment is a certain percentage of the fair market value that is determined by local assessors to be the total taxable value of land and additions on the property. | Land | Improvement |
|---|---|---|---|---|
| 2025 | $1,618 | $71,173 | $14,780 | $56,393 |
| 2024 | $1,618 | $69,101 | $14,350 | $54,751 |
| 2023 | $1,604 | $67,088 | $13,932 | $53,156 |
| 2022 | $2,515 | $65,134 | $13,526 | $51,608 |
| 2021 | $2,423 | $63,237 | $13,132 | $50,105 |
| 2020 | $2,376 | $61,396 | $12,750 | $48,646 |
| 2019 | $1,157 | $59,608 | $12,379 | $47,229 |
| 2018 | $2,210 | $59,608 | $12,379 | $47,229 |
| 2017 | $2,134 | $57,871 | $12,018 | $45,853 |
| 2016 | $2,066 | $54,550 | $11,329 | $43,221 |
| 2015 | $52,961 | $52,961 | $10,999 | $41,962 |
| 2014 | $1,994 | $52,961 | $10,999 | $41,962 |
| 2013 | -- | $52,961 | $10,999 | $41,962 |
Source: Public Records
Map
Nearby Homes
- 4500 Samara Rd NW
- 4612 Lobelia Rd NW
- 7432 Primrose Dr NW
- 7434 Riverton Dr NW
- 7516 Wells Fargo Trail NW
- 7708 Ridgeview Dr NW
- 4736 Galleta Rd NW
- 7739 Ridgeview Dr NW
- 7809 Juneberry St NW
- 7824 Snowberry St NW
- 7532 Deerfield Rd NW
- 7939 Independence Dr NW
- 4600 Waynesboro Place NW
- 5136 Roanoke Ave NW
- 4512 Waynesboro Rd NW
- 6921 El Cajon Ct NW
- 4309 Rancho Largo Rd NW
- 4515 Millwood Ct NW
- 4820 Summersville Dr NW
- 7557 Richmond Hill Rd NW
- 4528 Samara Rd NW
- 4520 Samara Rd NW
- 4537 Lobelia Rd NW
- 4516 Samara Rd NW
- 4532 Samara Rd NW
- 4533 Lobelia Rd NW
- 4541 Lobelia Rd NW
- 4529 Lobelia Rd NW
- 4525 Samara Rd NW
- 4521 Samara Rd NW
- 4512 Samara Rd NW
- 4545 Lobelia Rd NW
- 4536 Samara Rd NW
- 4517 Samara Rd NW
- 4529 Samara Rd NW
- 0 Sauvignon St NE
- 4601 Lobelia Rd NW
- 4525 Lobelia Rd NW
- 4533 Samara Rd NW
- 4540 Samara Rd NW