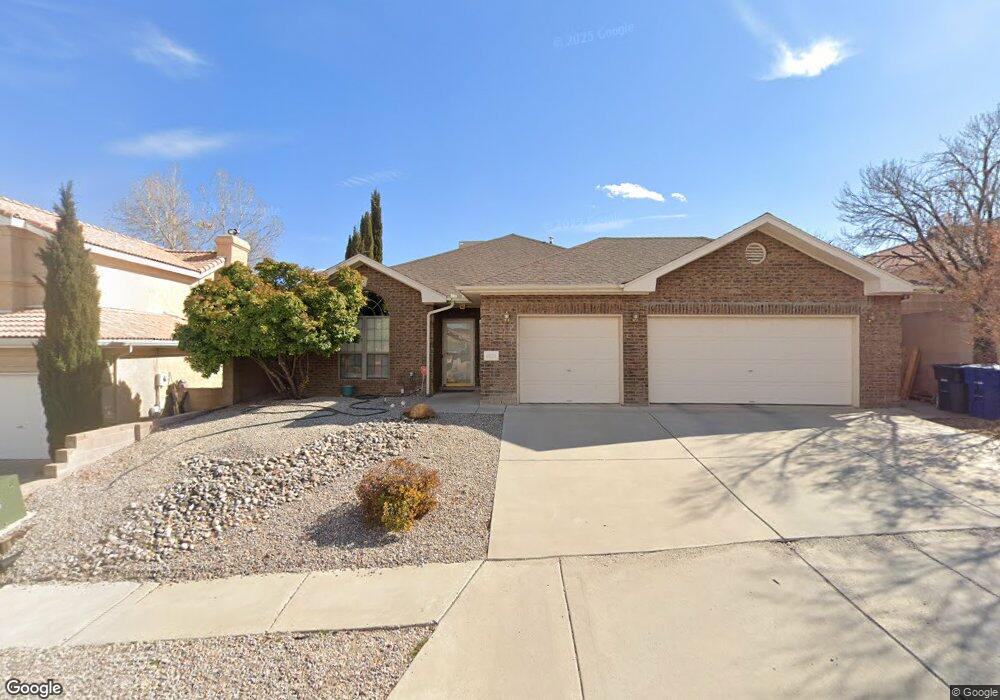
4524 Waynesboro Rd NW Albuquerque, NM 87120
Taylor Ranch NeighborhoodEstimated Value: $369,000 - $406,000
3
Beds
2
Baths
1,825
Sq Ft
$211/Sq Ft
Est. Value
About This Home
This home is located at 4524 Waynesboro Rd NW, Albuquerque, NM 87120 and is currently estimated at $384,205, approximately $210 per square foot. 4524 Waynesboro Rd NW is a home located in Bernalillo County with nearby schools including Chamiza Elementary School, L.B. Johnson Middle School, and Volcano Vista High School.
Ownership History
Date
Name
Owned For
Owner Type
Purchase Details
Closed on
Apr 23, 2009
Sold by
Snyder Jean
Bought by
Hudson Gerald C and Hudson Cynthia S
Current Estimated Value
Purchase Details
Closed on
Aug 30, 2007
Sold by
Koski Mark A and Koski Meredith N
Bought by
Snyder Jean
Purchase Details
Closed on
Aug 15, 2003
Sold by
Trujillo Anthony T
Bought by
Koski Mark A and Koski Meredith N
Home Financials for this Owner
Home Financials are based on the most recent Mortgage that was taken out on this home.
Original Mortgage
$166,000
Interest Rate
5.12%
Mortgage Type
Purchase Money Mortgage
Purchase Details
Closed on
Feb 15, 2000
Sold by
Jones Curtis N and Jones Angela P
Bought by
Trujillo Anthony T
Home Financials for this Owner
Home Financials are based on the most recent Mortgage that was taken out on this home.
Original Mortgage
$147,700
Interest Rate
7.12%
Create a Home Valuation Report for This Property
The Home Valuation Report is an in-depth analysis detailing your home's value as well as a comparison with similar homes in the area
Home Values in the Area
Average Home Value in this Area
Purchase History
| Date | Buyer | Sale Price | Title Company |
|---|---|---|---|
| Hudson Gerald C | -- | U S Title | |
| Snyder Jean | -- | U S Title | |
| Koski Mark A | -- | Albuquerque Title Co Inc | |
| Trujillo Anthony T | -- | First American Title Ins Co |
Source: Public Records
Mortgage History
| Date | Status | Borrower | Loan Amount |
|---|---|---|---|
| Previous Owner | Koski Mark A | $166,000 | |
| Previous Owner | Trujillo Anthony T | $147,700 |
Source: Public Records
Tax History Compared to Growth
Tax History
| Year | Tax Paid | Tax Assessment Tax Assessment Total Assessment is a certain percentage of the fair market value that is determined by local assessors to be the total taxable value of land and additions on the property. | Land | Improvement |
|---|---|---|---|---|
| 2025 | $3,312 | $80,492 | $18,828 | $61,664 |
| 2024 | $3,312 | $80,492 | $18,828 | $61,664 |
| 2023 | $3,254 | $78,149 | $18,280 | $59,869 |
| 2022 | $3,142 | $75,873 | $17,748 | $58,125 |
| 2021 | $3,034 | $73,663 | $17,231 | $56,432 |
| 2020 | $2,982 | $71,519 | $16,730 | $54,789 |
| 2019 | $2,892 | $69,436 | $16,243 | $53,193 |
| 2018 | $2,787 | $69,436 | $16,243 | $53,193 |
| 2017 | $2,698 | $67,414 | $15,770 | $51,644 |
| 2016 | $2,618 | $63,545 | $14,865 | $48,680 |
| 2015 | $61,694 | $61,694 | $14,432 | $47,262 |
| 2014 | $2,556 | $62,194 | $14,432 | $47,762 |
| 2013 | -- | $61,353 | $14,261 | $47,092 |
Source: Public Records
Map
Nearby Homes
- 4512 Waynesboro Rd NW
- 4600 Waynesboro Place NW
- 7824 Snowberry St NW
- 4515 Millwood Ct NW
- 7809 Juneberry St NW
- 7739 Ridgeview Dr NW
- 4820 Summersville Dr NW
- 7708 Ridgeview Dr NW
- 4309 Rancho Largo Rd NW
- 7939 Independence Dr NW
- 4320 La Paloma Rd NW
- 7516 Wells Fargo Trail NW
- 4500 Samara Rd NW
- 7432 Primrose Dr NW
- 8100 Rancho Viejo Ct NW
- 7434 Riverton Dr NW
- 7532 Deerfield Rd NW
- 4300 Ridgemont Ave NW
- 8416 Calle Primera NW
- 4612 Lobelia Rd NW
- 4520 Waynesboro Rd NW
- 4528 Waynesboro Rd NW
- 4532 Waynesboro Rd NW
- 4523 Waynesboro Rd NW
- 4516 Waynesboro Rd NW
- 4519 Waynesboro Rd NW
- 4527 Waynesboro Rd NW
- 4515 Waynesboro Rd NW
- 4536 Waynesboro Rd NW
- 4424 Riverhill Dr NW
- 4531 Waynesboro Rd NW
- 4431 Riverhill Dr NW
- 4416 Riverhill Dr NW
- 4540 Waynesboro Rd NW
- 4509 Waynesboro Rd NW
- 4508 Waynesboro Rd NW
- 4508 Harpers Ferry Ct NW
- 4512 Harpers Ferry Ct NW
- 4516 Harpers Ferry Ct NW
- 4535 Waynesboro Rd NW