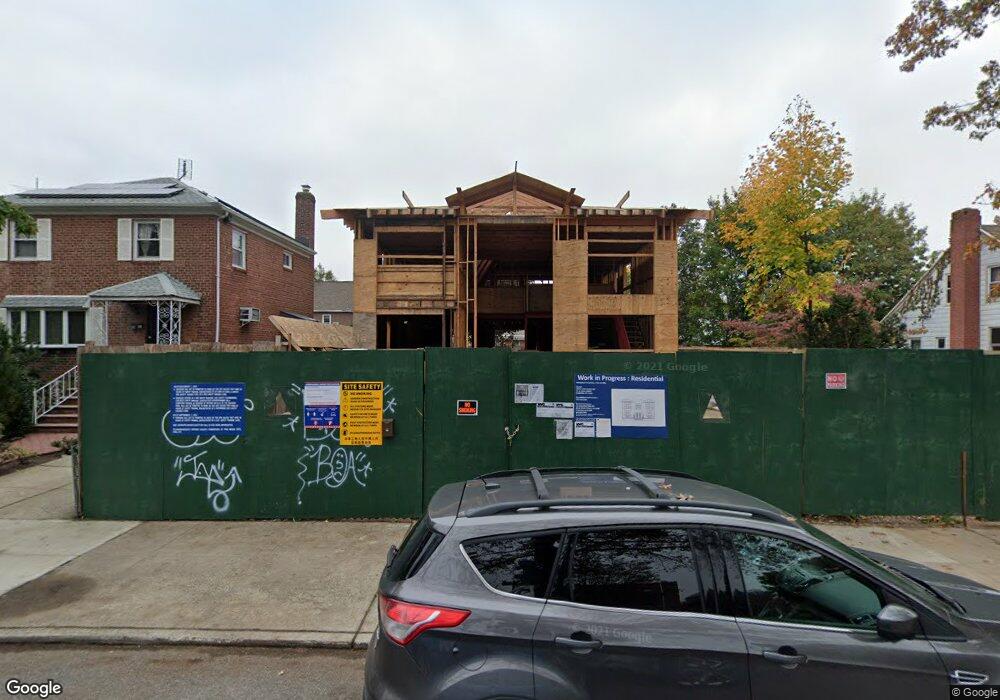
4525 195th St Flushing, NY 11358
Auburndale NeighborhoodEstimated Value: $1,027,000 - $1,743,000
--
Bed
--
Bath
2,862
Sq Ft
$501/Sq Ft
Est. Value
About This Home
This home is located at 4525 195th St, Flushing, NY 11358 and is currently estimated at $1,434,128, approximately $501 per square foot. 4525 195th St is a home located in Queens County with nearby schools including I.S. 25 Adrien Block, Francis Lewis High School, and St Kevin School.
Ownership History
Date
Name
Owned For
Owner Type
Purchase Details
Closed on
Apr 9, 2019
Sold by
Harty Kevin and Harty Mary
Bought by
Lucky Chen Family Inc
Current Estimated Value
Purchase Details
Closed on
Oct 2, 2002
Sold by
Romanello Harty Mary Patricia
Bought by
Harty Kevin and Harty Mary
Home Financials for this Owner
Home Financials are based on the most recent Mortgage that was taken out on this home.
Original Mortgage
$247,500
Interest Rate
6.18%
Mortgage Type
Purchase Money Mortgage
Purchase Details
Closed on
Nov 18, 1999
Sold by
Harty Mary Patricia Romanello and Lynskey John
Bought by
Harty Mary Patricia Romanello
Home Financials for this Owner
Home Financials are based on the most recent Mortgage that was taken out on this home.
Original Mortgage
$65,000
Interest Rate
7.71%
Create a Home Valuation Report for This Property
The Home Valuation Report is an in-depth analysis detailing your home's value as well as a comparison with similar homes in the area
Home Values in the Area
Average Home Value in this Area
Purchase History
| Date | Buyer | Sale Price | Title Company |
|---|---|---|---|
| Lucky Chen Family Inc | $786,500 | -- | |
| Lucky Chen Family Inc | $786,500 | -- | |
| Lucky Chen Family Inc | $786,500 | -- | |
| Harty Kevin | -- | -- | |
| Harty Kevin | -- | -- | |
| Harty Mary Patricia Romanello | -- | Titleworks Abstract Inc | |
| Harty Mary Patricia Romanello | -- | Titleworks Abstract Inc |
Source: Public Records
Mortgage History
| Date | Status | Borrower | Loan Amount |
|---|---|---|---|
| Previous Owner | Harty Kevin | $247,500 | |
| Previous Owner | Harty Mary Patricia Romanello | $65,000 |
Source: Public Records
Tax History Compared to Growth
Tax History
| Year | Tax Paid | Tax Assessment Tax Assessment Total Assessment is a certain percentage of the fair market value that is determined by local assessors to be the total taxable value of land and additions on the property. | Land | Improvement |
|---|---|---|---|---|
| 2025 | $15,449 | $79,307 | $22,826 | $56,481 |
| 2024 | $15,449 | $76,919 | $26,530 | $50,389 |
| 2023 | $15,621 | $76,919 | $22,399 | $54,520 |
| 2022 | $15,295 | $94,980 | $32,760 | $62,220 |
| 2021 | $8,924 | $48,540 | $18,300 | $30,240 |
| 2020 | $7,444 | $47,040 | $18,300 | $28,740 |
| 2019 | $6,940 | $48,960 | $18,300 | $30,660 |
| 2018 | $6,763 | $33,177 | $10,975 | $22,202 |
| 2017 | $6,712 | $32,926 | $12,187 | $20,739 |
| 2016 | $6,210 | $32,926 | $12,187 | $20,739 |
| 2015 | $3,746 | $29,306 | $13,353 | $15,953 |
| 2014 | $3,746 | $27,648 | $15,117 | $12,531 |
Source: Public Records
Map
Nearby Homes
- 45-31 195th St
- 46-03 195th St
- 4604 195th St
- 45-47 193rd St
- 4539 192nd St
- 43-28 196th St
- 45-39 192nd St
- 196-64 45th Ave
- 4320 196th St
- 4419 192nd St
- 19664 45th Ave
- 47-11 197th St
- 42-32 196th St
- 199-04 47th Ave
- 196-19 42nd Rd
- 42-36 201st St
- 47-69 195th St
- 4620 190th St
- 202-04 45th Dr
- 4048 194th St Unit A3