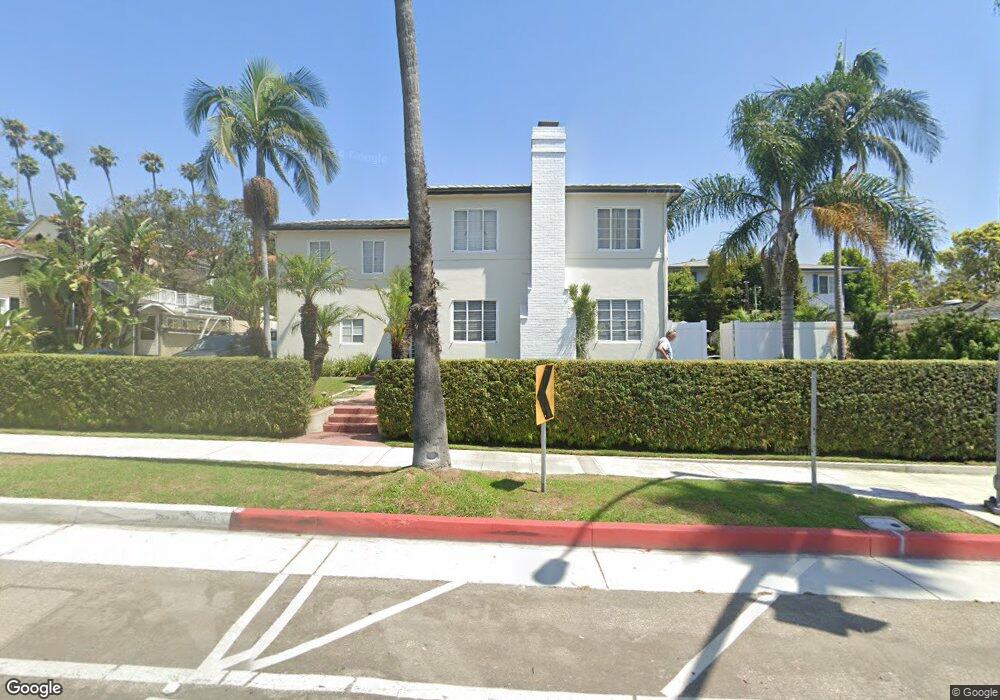
4525 E 2nd St Long Beach, CA 90803
Belmont Heights NeighborhoodEstimated Value: $1,382,000 - $1,648,000
3
Beds
3
Baths
1,892
Sq Ft
$797/Sq Ft
Est. Value
About This Home
This home is located at 4525 E 2nd St, Long Beach, CA 90803 and is currently estimated at $1,508,502, approximately $797 per square foot. 4525 E 2nd St is a home located in Los Angeles County with nearby schools including Lowell Elementary School, Rogers Middle School, and Woodrow Wilson High School.
Ownership History
Date
Name
Owned For
Owner Type
Purchase Details
Closed on
Jul 24, 2020
Sold by
Francisco George E
Bought by
Francisco John Thomas and Francisco Jo Stephanie
Current Estimated Value
Purchase Details
Closed on
Dec 3, 1996
Sold by
Coplin Patricia A
Bought by
Coplin William W
Home Financials for this Owner
Home Financials are based on the most recent Mortgage that was taken out on this home.
Original Mortgage
$150,000
Interest Rate
7.58%
Purchase Details
Closed on
Nov 22, 1996
Sold by
Coplin William W
Bought by
Francisco John Thomas and Francisco Jo Stephanie
Home Financials for this Owner
Home Financials are based on the most recent Mortgage that was taken out on this home.
Original Mortgage
$150,000
Interest Rate
7.58%
Create a Home Valuation Report for This Property
The Home Valuation Report is an in-depth analysis detailing your home's value as well as a comparison with similar homes in the area
Home Values in the Area
Average Home Value in this Area
Purchase History
| Date | Buyer | Sale Price | Title Company |
|---|---|---|---|
| Francisco John Thomas | -- | None Available | |
| Coplin William W | -- | North American Title Co | |
| Francisco John Thomas | $241,000 | North American Title Co |
Source: Public Records
Mortgage History
| Date | Status | Borrower | Loan Amount |
|---|---|---|---|
| Previous Owner | Francisco John Thomas | $150,000 |
Source: Public Records
Tax History
| Year | Tax Paid | Tax Assessment Tax Assessment Total Assessment is a certain percentage of the fair market value that is determined by local assessors to be the total taxable value of land and additions on the property. | Land | Improvement |
|---|---|---|---|---|
| 2025 | $5,234 | $395,745 | $274,747 | $120,998 |
| 2024 | $5,234 | $387,986 | $269,360 | $118,626 |
| 2023 | $5,146 | $380,379 | $264,079 | $116,300 |
| 2022 | $9,593 | $772,950 | $537,444 | $235,506 |
| 2021 | $4,650 | $365,610 | $253,825 | $111,785 |
| 2020 | $4,637 | $361,862 | $251,223 | $110,639 |
| 2019 | $4,582 | $354,768 | $246,298 | $108,470 |
| 2018 | $4,429 | $347,813 | $241,469 | $106,344 |
| 2016 | $4,065 | $334,309 | $232,094 | $102,215 |
| 2015 | $3,903 | $329,288 | $228,608 | $100,680 |
| 2014 | $3,878 | $322,838 | $224,130 | $98,708 |
Source: Public Records
Map
Nearby Homes
- 4527 E Shaw St
- 219 Ximeno Ave
- 4401 E Division St
- 111 Ximeno Ave
- 118 Roycroft Ave
- 150 Saint Joseph Ave
- 140 Saint Joseph Ave
- 132 Belmont Ave
- 105 Roswell Ave
- 153 Granada Ave
- 104 Saint Joseph Ave
- 116 Termino Ave
- 260 Prospect Ave
- 280 Park Ave
- 74 Argonne Ave
- 75 Granada Ave
- 202 Mira Mar Ave
- 235 Termino Ave Unit 1
- 28 Argonne Ave
- 207 Mira Mar Ave
- 203 Quincy Ave
- 201 Quincy Ave
- 4515 E 2nd St
- 205 Quincy Ave
- 4505 E 2nd St
- 202 Prospect Ave
- 204 Prospect Ave
- 207 Quincy Ave
- 4601 E Livingston Dr
- 206 Prospect Ave
- 209 Quincy Ave
- 4617 E Livingston Dr
- 204 Quincy Ave
- 208 Prospect Ave
- 4619 E Livingston Dr
- 206 Quincy Ave
- 211 Quincy Ave
- 4435 E 2nd St
- 203 Prospect Ave
- 178 Prospect Ave
Your Personal Tour Guide
Ask me questions while you tour the home.