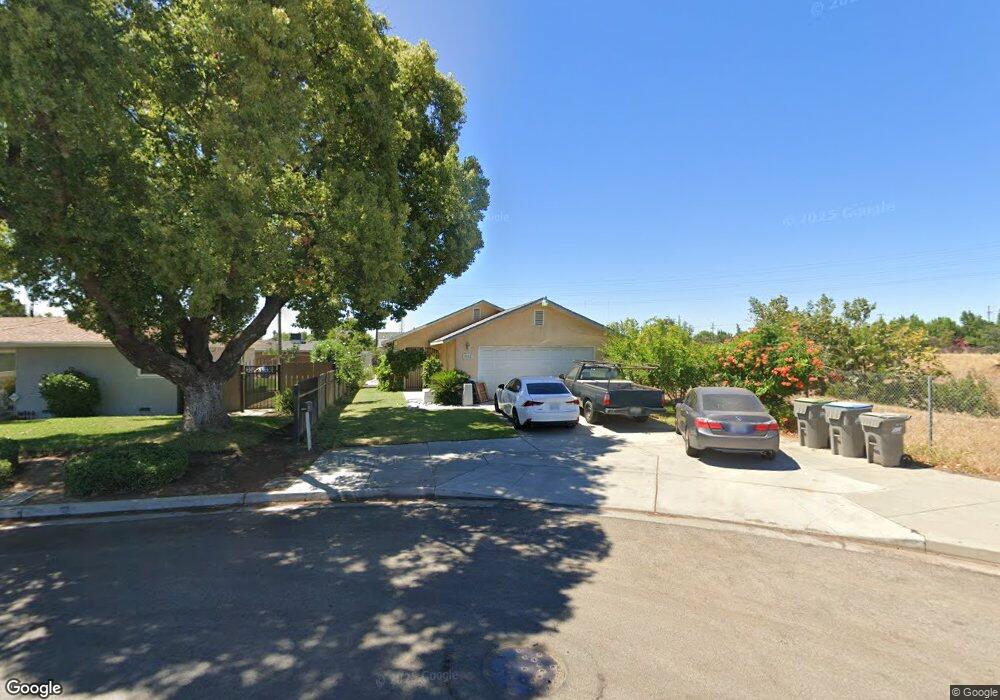
4526 E Harvard Ave Fresno, CA 93703
McLane NeighborhoodEstimated Value: $332,605 - $383,000
3
Beds
2
Baths
1,590
Sq Ft
$221/Sq Ft
Est. Value
About This Home
This home is located at 4526 E Harvard Ave, Fresno, CA 93703 and is currently estimated at $352,151, approximately $221 per square foot. 4526 E Harvard Ave is a home located in Fresno County with nearby schools including Norseman Elementary School, Scandinavian Middle School, and Mclane High School.
Ownership History
Date
Name
Owned For
Owner Type
Purchase Details
Closed on
Dec 24, 2009
Sold by
Simpson Marilou
Bought by
Simpson Don
Current Estimated Value
Purchase Details
Closed on
Mar 6, 2009
Sold by
U S Bank National Association
Bought by
Moua Greg C
Home Financials for this Owner
Home Financials are based on the most recent Mortgage that was taken out on this home.
Original Mortgage
$127,645
Interest Rate
5.02%
Mortgage Type
FHA
Purchase Details
Closed on
Dec 17, 2008
Sold by
Simpson Don
Bought by
Us Bank National Association
Purchase Details
Closed on
Feb 21, 2007
Sold by
Simpson Marilou
Bought by
Simpson Don
Home Financials for this Owner
Home Financials are based on the most recent Mortgage that was taken out on this home.
Original Mortgage
$240,800
Interest Rate
8.98%
Mortgage Type
New Conventional
Create a Home Valuation Report for This Property
The Home Valuation Report is an in-depth analysis detailing your home's value as well as a comparison with similar homes in the area
Home Values in the Area
Average Home Value in this Area
Purchase History
| Date | Buyer | Sale Price | Title Company |
|---|---|---|---|
| Simpson Don | -- | Fidelity National Title Co | |
| Moua Greg C | $130,000 | Lsi Title Agency | |
| Us Bank National Association | $140,250 | None Available | |
| Simpson Don | -- | Financial Title Company |
Source: Public Records
Mortgage History
| Date | Status | Borrower | Loan Amount |
|---|---|---|---|
| Previous Owner | Moua Greg C | $127,645 | |
| Previous Owner | Simpson Don | $240,800 |
Source: Public Records
Tax History Compared to Growth
Tax History
| Year | Tax Paid | Tax Assessment Tax Assessment Total Assessment is a certain percentage of the fair market value that is determined by local assessors to be the total taxable value of land and additions on the property. | Land | Improvement |
|---|---|---|---|---|
| 2025 | $2,046 | $167,395 | $51,503 | $115,892 |
| 2023 | $2,046 | $160,897 | $49,504 | $111,393 |
| 2022 | $1,980 | $157,743 | $48,534 | $109,209 |
| 2021 | $1,926 | $154,651 | $47,583 | $107,068 |
| 2020 | $1,918 | $153,067 | $47,096 | $105,971 |
| 2019 | $1,843 | $150,067 | $46,173 | $103,894 |
| 2018 | $1,803 | $147,125 | $45,268 | $101,857 |
| 2017 | $1,773 | $144,241 | $44,381 | $99,860 |
| 2016 | $1,714 | $141,413 | $43,511 | $97,902 |
| 2015 | $1,688 | $139,290 | $42,858 | $96,432 |
| 2014 | $1,657 | $136,563 | $42,019 | $94,544 |
Source: Public Records
Map
Nearby Homes
- 2238 N Maple Ave
- 4625 E Princeton Ave
- 4597 E Cambridge Ave
- 4454 E Simpson Ave
- 4674 E Princeton Ave
- 4641 E Weldon Ave
- 4704 E Simpson Ave
- 4747 E Clinton Ave
- 4318 E Fairfax Ave
- 2441 N Chestnut Ave
- 4787 E Cornell Ave
- 4463 E Home Ave
- 4453 E Home Ave
- 4791 E Simpson Ave
- 3803 E Clinton Ave
- 3926 E Fountain Way
- 3803 E Shields Ave
- 3445 N 9th St
- 4617 E Garland Ave
- 2042 Mayfair Dr E
- 4525 E Terrace Ave
- 4535 E Terrace Ave
- 4517 E Terrace Ave
- 4536 E Harvard Ave
- 4545 E Terrace Ave
- 4536 E Terrace Ave
- 4546 E Harvard Ave
- 4544 E Terrace Ave
- 4533 E Harvard Ave
- 4537 E Clinton Ave
- 4555 E Terrace Ave
- 4541 E Harvard Ave
- 4545 E Clinton Ave
- 4554 E Harvard Ave
- 2428 N Jackson Ave
- 2420 N Jackson Ave
- 4536 E Brown Ave
- 4491 E Terrace Ave
- 4496 E Terrace Ave
- 4555 E Harvard Ave