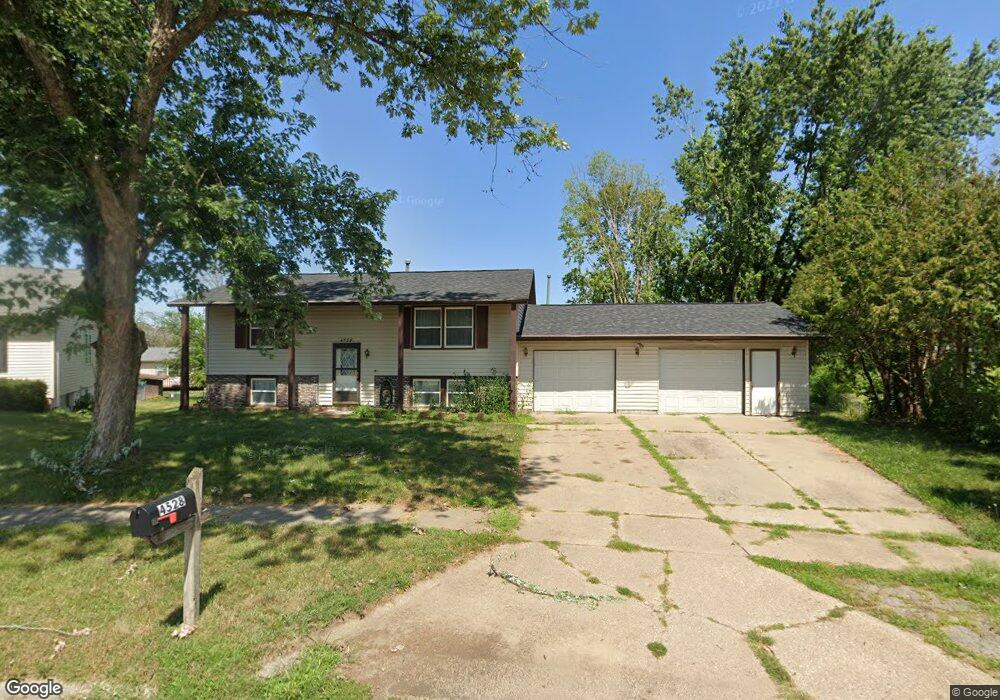
4528 Lantern Ct Marion, IA 52302
Estimated Value: $203,000 - $208,000
5
Beds
2
Baths
864
Sq Ft
$237/Sq Ft
Est. Value
About This Home
This home is located at 4528 Lantern Ct, Marion, IA 52302 and is currently estimated at $204,775, approximately $237 per square foot. 4528 Lantern Ct is a home located in Linn County with nearby schools including Linn Grove Elementary School, Excelsior Middle School, and Linn-Mar High School.
Ownership History
Date
Name
Owned For
Owner Type
Purchase Details
Closed on
Sep 16, 2020
Sold by
Omalley Brady Fq and Omalley Niki
Bought by
Omalley Brady Q
Current Estimated Value
Home Financials for this Owner
Home Financials are based on the most recent Mortgage that was taken out on this home.
Original Mortgage
$136,796
Outstanding Balance
$121,121
Interest Rate
2.9%
Mortgage Type
FHA
Estimated Equity
$83,654
Purchase Details
Closed on
Feb 7, 2018
Sold by
Estate Of Wilma J Greene
Bought by
Omalley Brady Q and Omalley Niki
Home Financials for this Owner
Home Financials are based on the most recent Mortgage that was taken out on this home.
Original Mortgage
$113,600
Interest Rate
4.04%
Mortgage Type
New Conventional
Purchase Details
Closed on
Apr 7, 2010
Sold by
Greene William L and Greene Wilma J
Bought by
Greene Wilma J
Create a Home Valuation Report for This Property
The Home Valuation Report is an in-depth analysis detailing your home's value as well as a comparison with similar homes in the area
Home Values in the Area
Average Home Value in this Area
Purchase History
| Date | Buyer | Sale Price | Title Company |
|---|---|---|---|
| Omalley Brady Q | -- | None Listed On Document | |
| Omalley Brady Q | -- | Hale Leila L | |
| Omalley Brady Q | $142,000 | None Available | |
| Greene Wilma J | -- | None Available |
Source: Public Records
Mortgage History
| Date | Status | Borrower | Loan Amount |
|---|---|---|---|
| Open | Omalley Brady Q | $136,796 | |
| Closed | Omalley Brady Q | $136,796 | |
| Previous Owner | Omalley Brady Q | $113,600 |
Source: Public Records
Tax History
| Year | Tax Paid | Tax Assessment Tax Assessment Total Assessment is a certain percentage of the fair market value that is determined by local assessors to be the total taxable value of land and additions on the property. | Land | Improvement |
|---|---|---|---|---|
| 2025 | $3,182 | $201,600 | $46,900 | $154,700 |
| 2024 | $3,800 | $179,700 | $46,900 | $132,800 |
| 2023 | $3,800 | $179,700 | $46,900 | $132,800 |
| 2022 | $3,620 | $180,100 | $46,900 | $133,200 |
| 2021 | $3,630 | $180,100 | $46,900 | $133,200 |
| 2020 | $3,630 | $161,100 | $46,900 | $114,200 |
| 2019 | $3,402 | $161,100 | $46,900 | $114,200 |
| 2018 | $3,270 | $150,800 | $46,900 | $103,900 |
| 2017 | $2,618 | $145,900 | $46,900 | $99,000 |
| 2016 | $2,618 | $121,300 | $23,800 | $97,500 |
| 2015 | $2,609 | $121,300 | $23,800 | $97,500 |
| 2014 | $2,422 | $121,300 | $23,800 | $97,500 |
| 2013 | $2,308 | $121,300 | $23,800 | $97,500 |
Source: Public Records
Map
Nearby Homes
- 1370 44th St Unit E
- 1370 48th St
- 1890 50th St
- 2124 49th St Unit 2124
- 2262 49th St Unit 2262
- 2130 Rosewood Ridge Dr
- 5425 Kacena Ave Unit B
- 4460 Teal Ct Unit 4460
- 4315 Snowgoose Dr
- 1870 Sugaridge Dr
- 4325 Pintail Dr
- 4565 Widgeon Ct Unit 4565
- 892 35th St
- 1340 38th Street Place
- 1300 35th St
- 5975 Carlson Way
- 2725 50th St
- 3490 Willowridge Rd Unit C
- 3490 Willowridge Rd Unit D
- 3460 Willowridge Rd Unit D
Your Personal Tour Guide
Ask me questions while you tour the home.